
Key points:
- The significance of government contracts for Dell increased between calendar years 2021 and 2025, with contract awards growing at over 6% annually, roughly double the company’s 3% revenue growth rate.
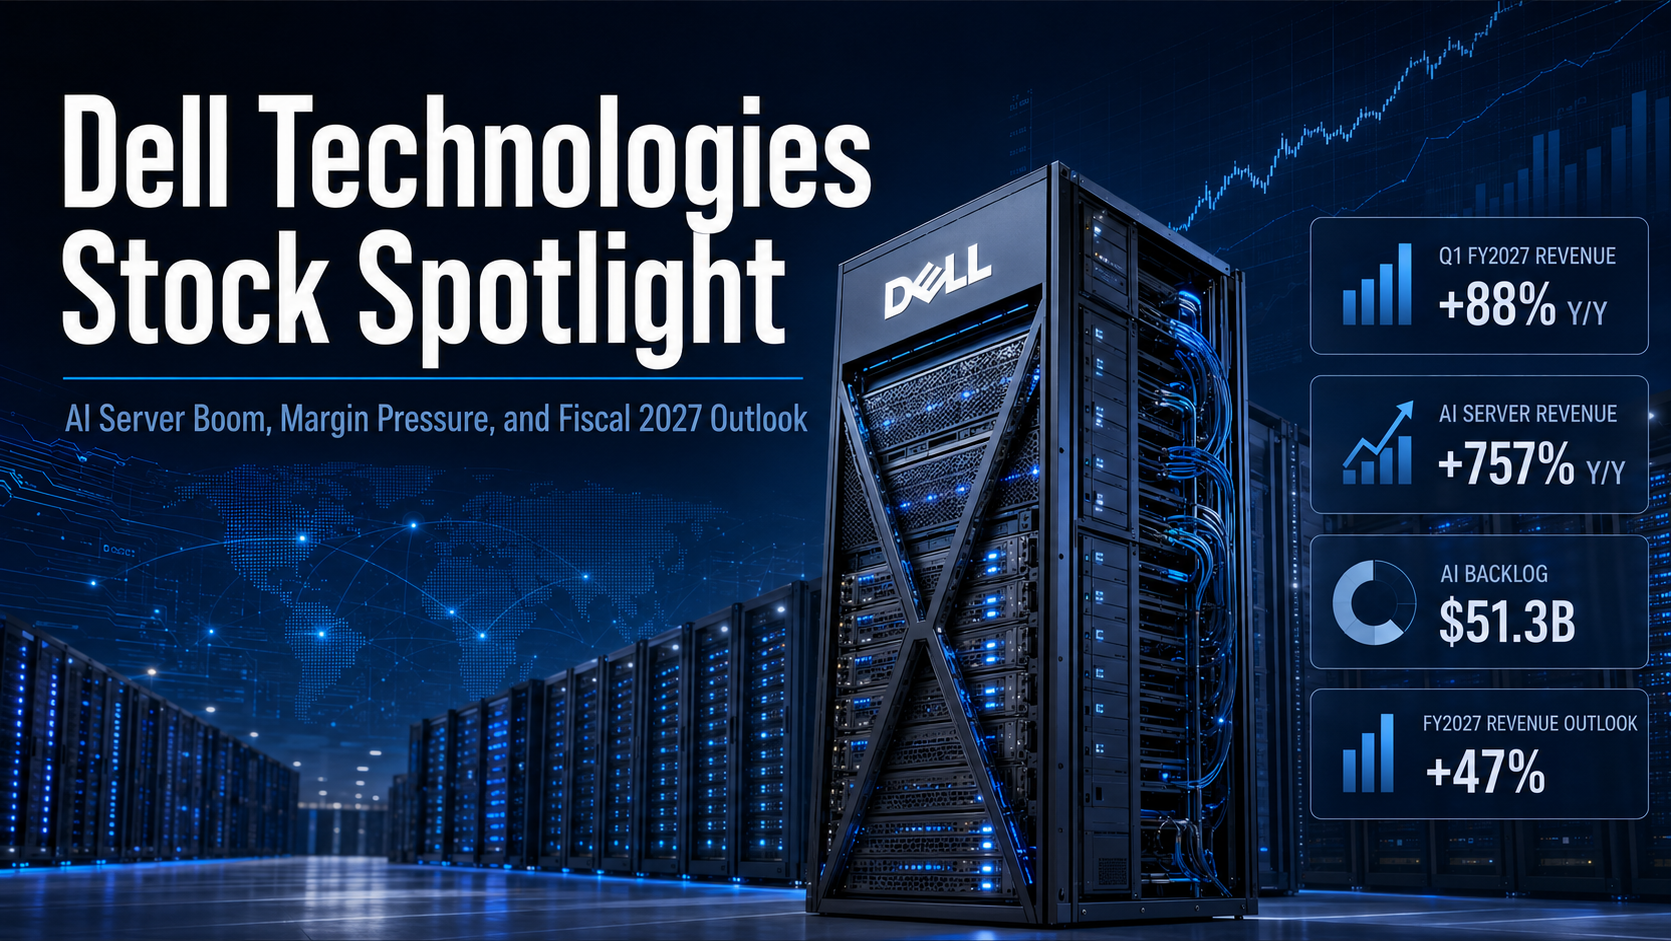
- More recently in Q1 of fiscal 2027, the company has seen a notable acceleration in revenue momentum, principally driven by demand for AI servers.
- We use TenderAlpha data to map Dell’s key government customers and B2B counterparties, helping investors identify where AI server demand and public-sector IT spending may create follow-on opportunities across suppliers, customers, and partners.
Dell Technologies’ Major Customers and Trade Flows Counterparties
Before examining Dell Technologies’ latest financials, we first map the company’s government customers and business-to-business [B2B] trade-flow relationships. For investors, this helps connect Dell’s reported revenue growth to the public-sector buyers, enterprise customers, suppliers, and technology partners that may influence future demand, margins, and counterparty exposure.
Activity as a government supplier
Dell’s government contracting activity has shown steady growth in recent years, reaching a record $3.9 billion in calendar year 2025, with year-to-date contract awards as of July 2026 already standing at $2.4 billion. TenderAlpha Pro’s contract-level view helps separate one-off large awards from recurring government demand. In early 2026, for example, Dell’s award activity included a major European High-Performance Computing Joint Undertaking contract for an AI-optimized supercomputer, alongside more traditional awards from buyers such as the Department of the Air Force and the Department of the Navy for software, cybersecurity, and IT services.
In Table 1 below, we have summarized Dell’s government contracting activity between 2021 and 2026. The table shows that the company’s contract awards in 2025 have increased by over 6% annually since 2021, as per TenderAlpha global government contracts data:
Table 1: Dell Technologies government contracting activity, 2021–2026
| Year | Total Value (USD) | Number of Contracts |
|---|---|---|
| 2026 | 2,362,580,860 | 823 |
| 2025 | 3,854,584,939 | 2,147 |
| 2024 | 3,748,555,428 | 2,634 |
| 2023 | 3,371,356,093 | 2,805 |
| 2022 | 2,686,941,241 | 2,933 |
| 2021 | 3,010,730,185 | 2,835 |
With Dell revenues growing by only 3% per year between 2021 and 2025, the more than 6% annual expansion in public contract awards points to the rising strategic importance of government demand. Because award value is not the same as recognized revenue, the comparison should be read as a directional signal rather than a direct revenue bridge. Even so, it suggests that public-sector IT spending has become a more important part of Dell’s growth mix.
While Dell has seen a strong start to 2026 in government contract awards, TenderAlpha Pro’s quarterly award history helps investors avoid over-extrapolating from early-year momentum. Dell typically books more than half of its government awards in the first half of the year, which means it is still too early to conclude that 2026 awards will exceed the record level reached in 2025.
Next, we turn our attention to Dell’s five largest government contractors in the military and civilian space, as summarized in Table 2 below:
Table 2: Top five Dell government customers, 2010–2026
| Contracting Entity | Value of Contracts (USD) | Number of Federal Contract Transactions |
|---|---|---|
| Department of the Army | 5,376,400,738 | 15,228 |
| Department of Veterans Affairs | 4,911,700,592 | 1,564 |
| Department of the Air Force | 3,439,493,642 | 4,527 |
| Department of the Navy | 2,721,286,024 | 6,671 |
| Social Security Administration | 1,186,691,715 | 924 |
The data in Table 2 shows that some agencies, such as the Department of the Army, tend to award a large number of relatively small-value contracts. In contrast, other agencies, such as the Department of Veterans Affairs, award a smaller number of high-value government contracts.
The granular, contract-level data available on TenderAlpha Pro allows users to monitor Dell’s government awards in real time, with contract values starting from under $1000 to as much as hundreds of millions of dollars.
This distinction is visible across Dell’s government customer base. The Defense Information Systems Agency, the Department of Health and Human Services, and the National Park Service have each awarded more than 1,000 Dell-related contracts since 2010, illustrating how fragmented public-sector IT demand can accumulate into meaningful long-term exposure.
The same contract-level visibility is also useful for identifying companies that work alongside Dell on government programs. Where Dell acts as a subcontractor, partner, or supplier within a broader award structure, investors can better understand which companies may share exposure to the same public-sector technology budgets. This provides a natural transition to Dell’s B2B relationships, which we discuss next.
Business-to-business activity
While the significance of government contracting activity for Dell has increased in recent years, the company still depends for over 90% of its revenues on the private sector. As such, Dell’s B2B relationships are characterized by high intensity and diversity.
Looking through TenderAlpha Pro data, Dell’s business is characterized by a large volume of intercompany transactions, principally involving hardware, electronics, and computing equipment. The availability of harmonized system [HS] codes gives investors product-level context, making it easier to separate general electronics flows from the categories most closely tied to AI infrastructure, servers, and enterprise computing demand.
Intercompany transactions aside, TenderAlpha data also shows Dell-linked trade-flow activity involving international counterparties such as Vietnam Post and Toshiba Corporation. In Vietnam Post’s case, the relationship appears to be logistics- and supply-chain-oriented rather than a conventional customer relationship. Vietnam Post Logistics supports Dell projects in Vietnam through bonded warehousing, storage, customs declarations, and subcontracting services, including work under primary logistics providers. More broadly, the observed flows concern hardware, electronics, and computing equipment moving through Asian supply chains, including China and Singapore. They should therefore be read as evidence of operational relationships rather than automatically interpreted as direct Dell sales to Vietnam Post.
In contrast, Dell’s supplier base is more exposed to the United States, with the company’s largest supplier being Intel Corporation. Dell’s other suppliers are mostly international, such as EMC Information Systems International and QISDA Japan, although the relationship intensity is orders of magnitude smaller than that of Intel.
These relationships are summarized in Table 3 below, which provides insights derived from TenderAlpha’s global trade flows data, identifying major counterparties associated with inbound and outbound shipment activity involving Dell Technologies. Because these records may reflect supplier, subcontractor, partner, logistics, research, or program-related activity, they are best read as indicators of relationship intensity rather than direct measures of procurement spend or recognized revenue.
Table 3: Key B2B counterparties associated with Dell Technologies trade flows, 2019–2026
| Counterparty | Trade flows profile | Inbound flow | Outbound flow |
|---|---|---|---|
| Intel | Primarily inbound activity | High | — |
| EMC Information Systems International | Inbound activity | Moderate | — |
| QISDA Japan | Primarily inbound activity | Low | — |
| Vietnam Post | Primarily outbound activity | — | Moderate |
| Toshiba Corporation | Primarily outbound activity | — | Low |
From the data presented in Table 3, Dell’s primary B2B counterparties are mostly private companies, with Intel as the notable public exception. This matters because some beneficiaries of Dell’s AI-driven growth may not be visible through public equity screens alone. For private equity investors, supplier and customer relationship data can help identify private companies with exposure to Dell’s infrastructure growth before that exposure is obvious in traditional financial datasets.
From a public-company perspective, Dell’s relationship with Intel is the most visible counterparty signal. TenderAlpha Pro data shows several large transactions between the two companies in 2025, reflecting the importance of Intel to Dell’s AI infrastructure ecosystem. For investors, tracking this relationship can help connect Dell’s AI server momentum with upstream technology partners that may benefit from sustained infrastructure demand.
Dell Technologies’ Financial Performance
Now that we have covered DELL’s government and key B2B relationships, let’s discuss the company’s latest financial developments.
Q1 2027 Financial Results Overview
Dell has a fiscal year ending in January, with the latest available results reflecting performance in the quarter ending May 1, 2026 (Q1 of fiscal 2027). The company presents results in two reporting segments, namely the aforementioned Infrastructure Solutions Group (ISG, covering Dell’s infrastructure offering) at 67% of Q1 2027 revenues, with the remaining 33% booked in the Client Solutions Group (CSG, covering Dell’s personal hardware offering):
Table 4: Results breakdown between segments
| $ in millions, except percentages | May 1, 2026 | May 2, 2025 | Change |
|---|---|---|---|
| Infrastructure Solutions Group (ISG) | |||
| Net revenue | |||
| AI-optimized servers | $16,132 | $1,882 | 757% |
| Traditional servers and networking | 8,543 | 4,439 | 92% |
| Storage | 4,334 | 3,996 | 8% |
| Total ISG net revenue | $29,009 | $10,317 | 181% |
| Operating income | |||
| ISG operating income | $3,055 | $998 | 206% |
| % of ISG net revenue | 10.5% | 9.7% | |
| % of total reportable segment operating income | 72% | 60% | |
| Client Solutions Group (CSG) | |||
| Net revenue | |||
| Commercial | $13,020 | $11,046 | 18% |
| Consumer | 1,589 | 1,463 | 9% |
| Total CSG net revenue | $14,609 | $12,509 | 17% |
| Operating income | |||
| CSG operating income | $1,170 | $653 | 79% |
| % of CSG net revenue | 8.0% | 5.2% | |
| % of total reportable segment operating income | 28% | 40% | |
Dell reported an 88% increase in Q1 2027 revenues, principally driven by growth in ISG sales, where AI-optimized servers revenue jumped more than sevenfold. Somewhat counterintuitively, DELL’s gross margins actually declined to 17.8% (2026: 21.1%), as product and service costs increased at an ever faster rate of 96% Y/Y, likely impacted by soaring memory costs.
Even so, Dell’s modest 9% increase in operating expenses allowed for a 214% increase in operating income, which, coupled with higher other income thanks to fair value gains, helped push DELL’s earnings to $5.24/share, a 282% year-over-year increase.
To sum up, while Dell couldn’t pass on all product cost increases to customers, the company demonstrated strong cost control, allowing it to nevertheless achieve impressive bottom-line results. The only red flag we would highlight is that non-GAAP EPS, which adjusts for the volatility in other income but also adds back stock-based compensation, was somewhat lower at $4.86/share, still a stellar 214% jump Y/Y.
Increased Financial Outlook
Given the very strong start of the year, Dell increased its full-year revenue growth outlook to 47%, which nevertheless implies a slowdown from the 88% increase observed in Q1 2027. Likewise, the company expects non-GAAP EPS of around $17.90/share in fiscal 2027, a circa 74% improvement relative to 2026.
The silver lining is that Q2 2027 growth is expected to remain somewhat stronger, with revenue jumping by roughly 50% while non-GAAP EPS grows in the low triple digits. As such, while Dell’s revenue and EPS momentum likely peaked in Q1 2027, the company should enter 2028 with strong top- and bottom-line momentum, as highlighted on the conference call:
“We exited the quarter with a record $51.3 billion of AI backlog, and our pipeline continued to grow sequentially and remains multiples of our backlog, even after converting $24.4 billion into orders. Demand continues to exceed supply with memory as the primary constraint and we expect to exit the year with meaningful backlog. Our customer count surpassed 5,000 with growth across neocloud, sovereigns, and enterprise customers.”
Revenue and Margin Backdrop
To help us put Dell’s recent growth surge into context, in Table 5 we have presented the company’s GAAP gross margins and year-over-year revenue developments over the last decade:
Table 5: Revenue and gross margin developments, fiscal 2017-2027
| Period | GAAP gross margin | Revenue growth year-over-year |
|---|---|---|
| Q1 2027 | 17.8% | 88% |
| Fiscal 2026 | 20.0% | 19% |
| Fiscal 2025 | 22.2% | 8% |
| Fiscal 2024 | 23.8% | -14% |
| Fiscal 2023 | 22.2% | 1% |
| Fiscal 2022 | 21.6% | 17% |
| Fiscal 2021 | 23.2% | 2% |
| Fiscal 2020 | 31.4% | 2% |
| Fiscal 2019 | 27.6% | 15% |
| Fiscal 2018 | 26.0% | 27% |
| Fiscal 2017 | 22.0% | 22% |
Table 5 shows that Dell’s Q1 2027 gross margin weakness is a continuation of the overall margin pressures the company has seen since fiscal 2020, when gross margins peaked at 31.4%. While margin weakness between fiscal 2022 and fiscal 2026 can be explained by muted topline growth of about 3% annually over the period, the Q1 2027 dramatic surge in Dell’s topline has failed to produce a meaningful margin uplift.
In contrast, the last time the company enjoyed a sustained increase in revenues between fiscal 2017 and fiscal 2020, Dell’s gross margins improved consistently, climbing from 22% to the aforementioned peak of 31.4%. If history is any guide, we would expect Dell’s gross margins to recover in the remainder of 2027 and into 2028, akin to what happened with Micron (as discussed in our coverage here).
Conclusion
The significance of government contracting for Dell Technologies increased between calendar years 2021 and 2025, with the >6% annual growth rate of government contract awards roughly double the 3% headline revenue growth rate reported by Dell.
More recently, the company has seen a notable acceleration of revenue momentum, principally driven by Dell’s AI chip servers business. Alas, this is yet to translate into higher gross margins, in contrast to the previous high-growth period the company experienced up to 2020.
Against this dynamic backdrop, TenderAlpha Pro helps investors connect Dell’s reported financial momentum with the government customers, suppliers, and B2B counterparties behind that growth. That matters in an AI-driven hardware cycle where margin pressure, memory constraints, and supplier exposure can determine whether revenue growth translates into durable earnings expansion.
Contact us to request a TenderAlpha Pro demo and see how transaction-level government contracting and trade-flow data can support company analysis, counterparty mapping, and investment research.