
TenderAlpha’s cross-border transactional B2B trade flows data – capturing non-domestic customs transactions – shows a clear upward trajectory in Micron Technology’s supplier-side transaction value between 2022 and 2025. Transaction value rose from $24.7 million in 2022 to $495.5 million in 2025, pointing to a sharp expansion in the value of Micron’s observable cross-border buyer relationships.
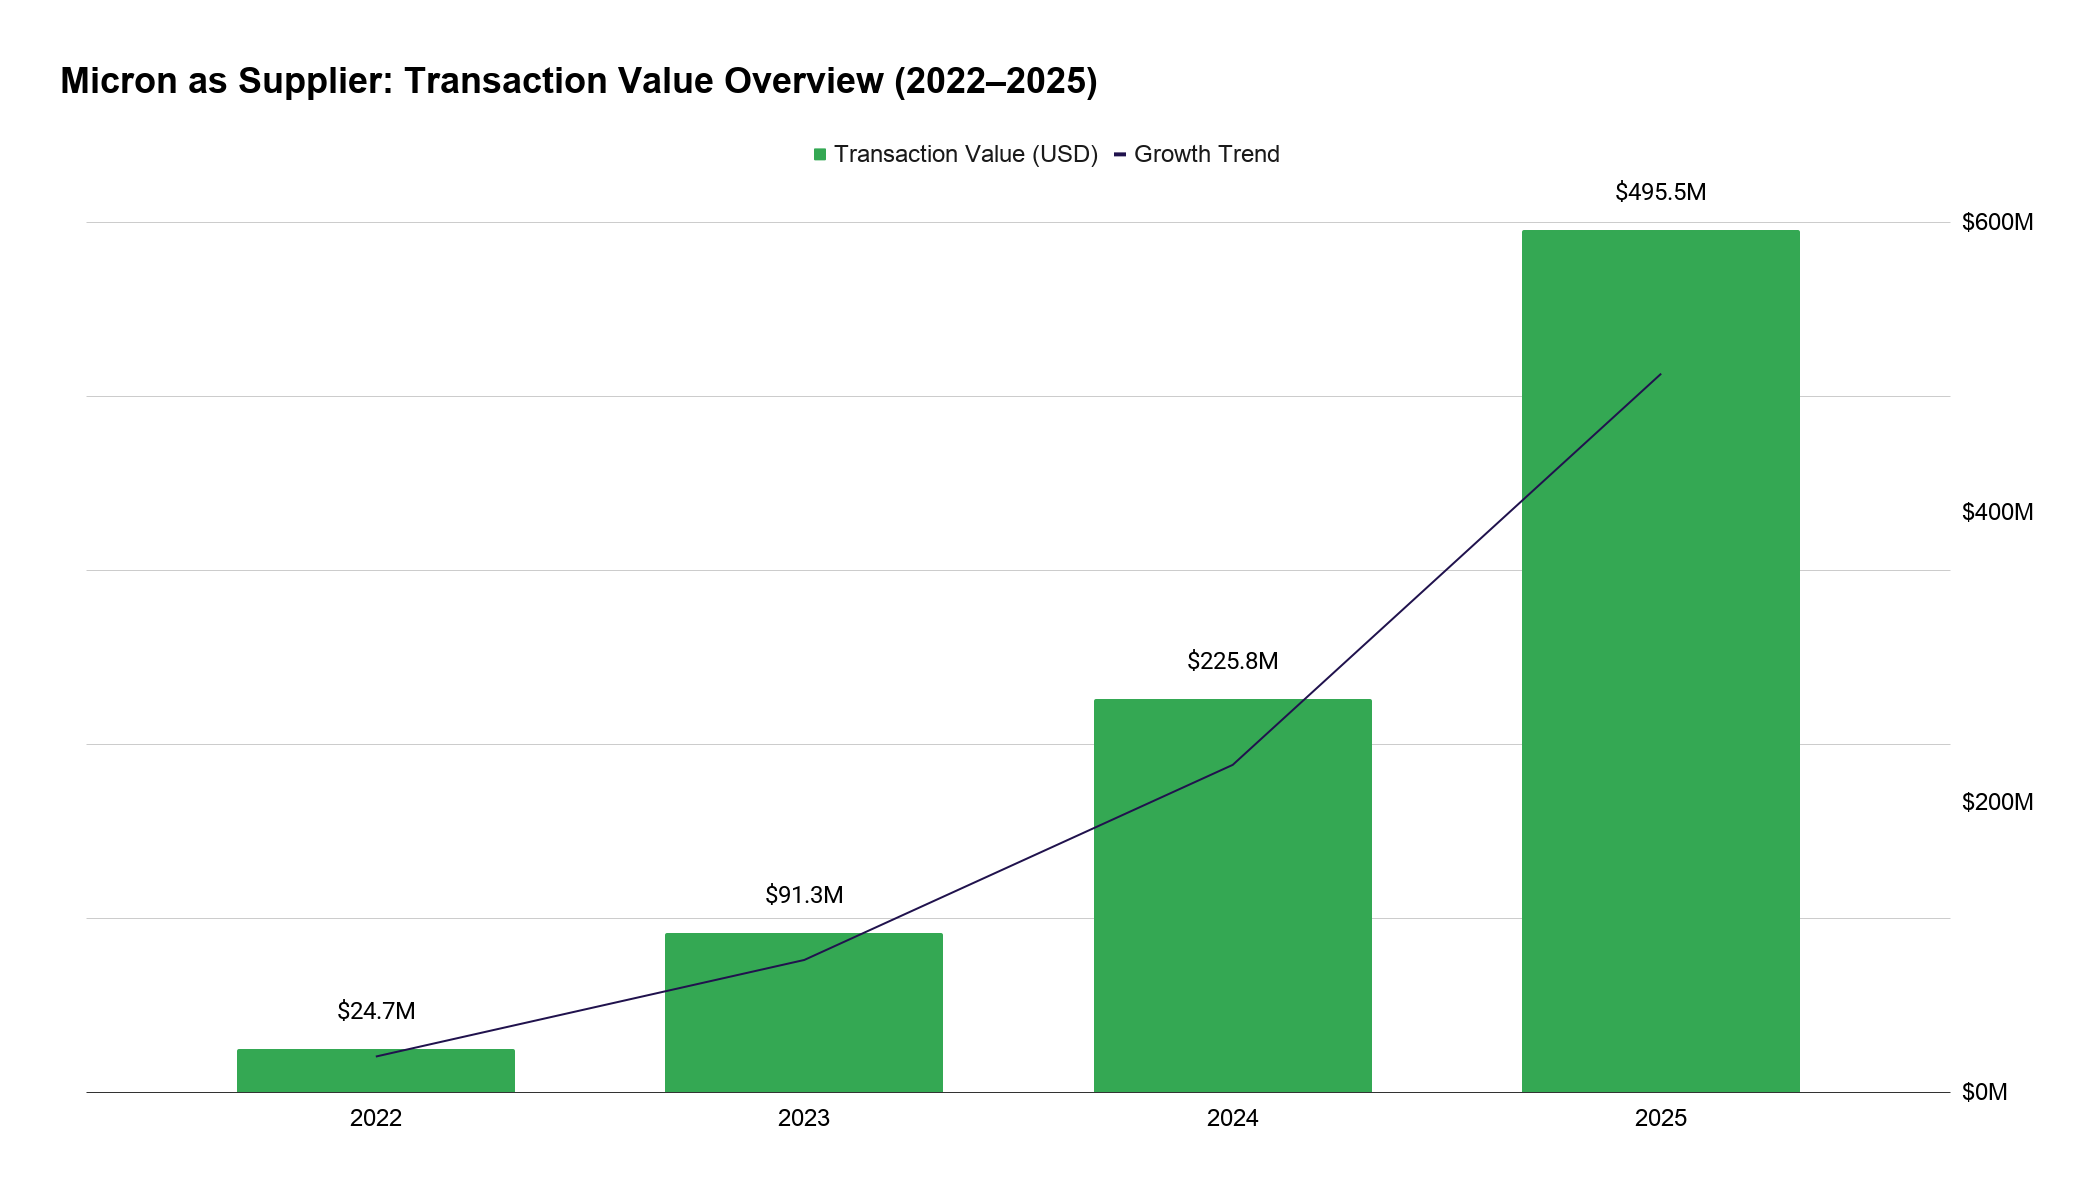
Figure 1: Micron Technology Supplier-Side Transaction Value Growth, 2022–2025
Source: TenderAlpha Pro
Stock Momentum and the AI Memory Narrative
The growth in Micron’s cross-border B2B transaction value coincided with the company’s meteoric stock price rise over the past year. From the June 2025 monthly close of $123.25 to the latest available June 2026 close of $1,211.38 on June 22, MU rose by roughly 883%, or 9.8x. The move remained especially sharp in the final stretch, with the stock moving well above its May 2026 closing level of $928.41, as investor enthusiasm around AI-driven memory demand continued to support the re-rating of Micron’s market value.
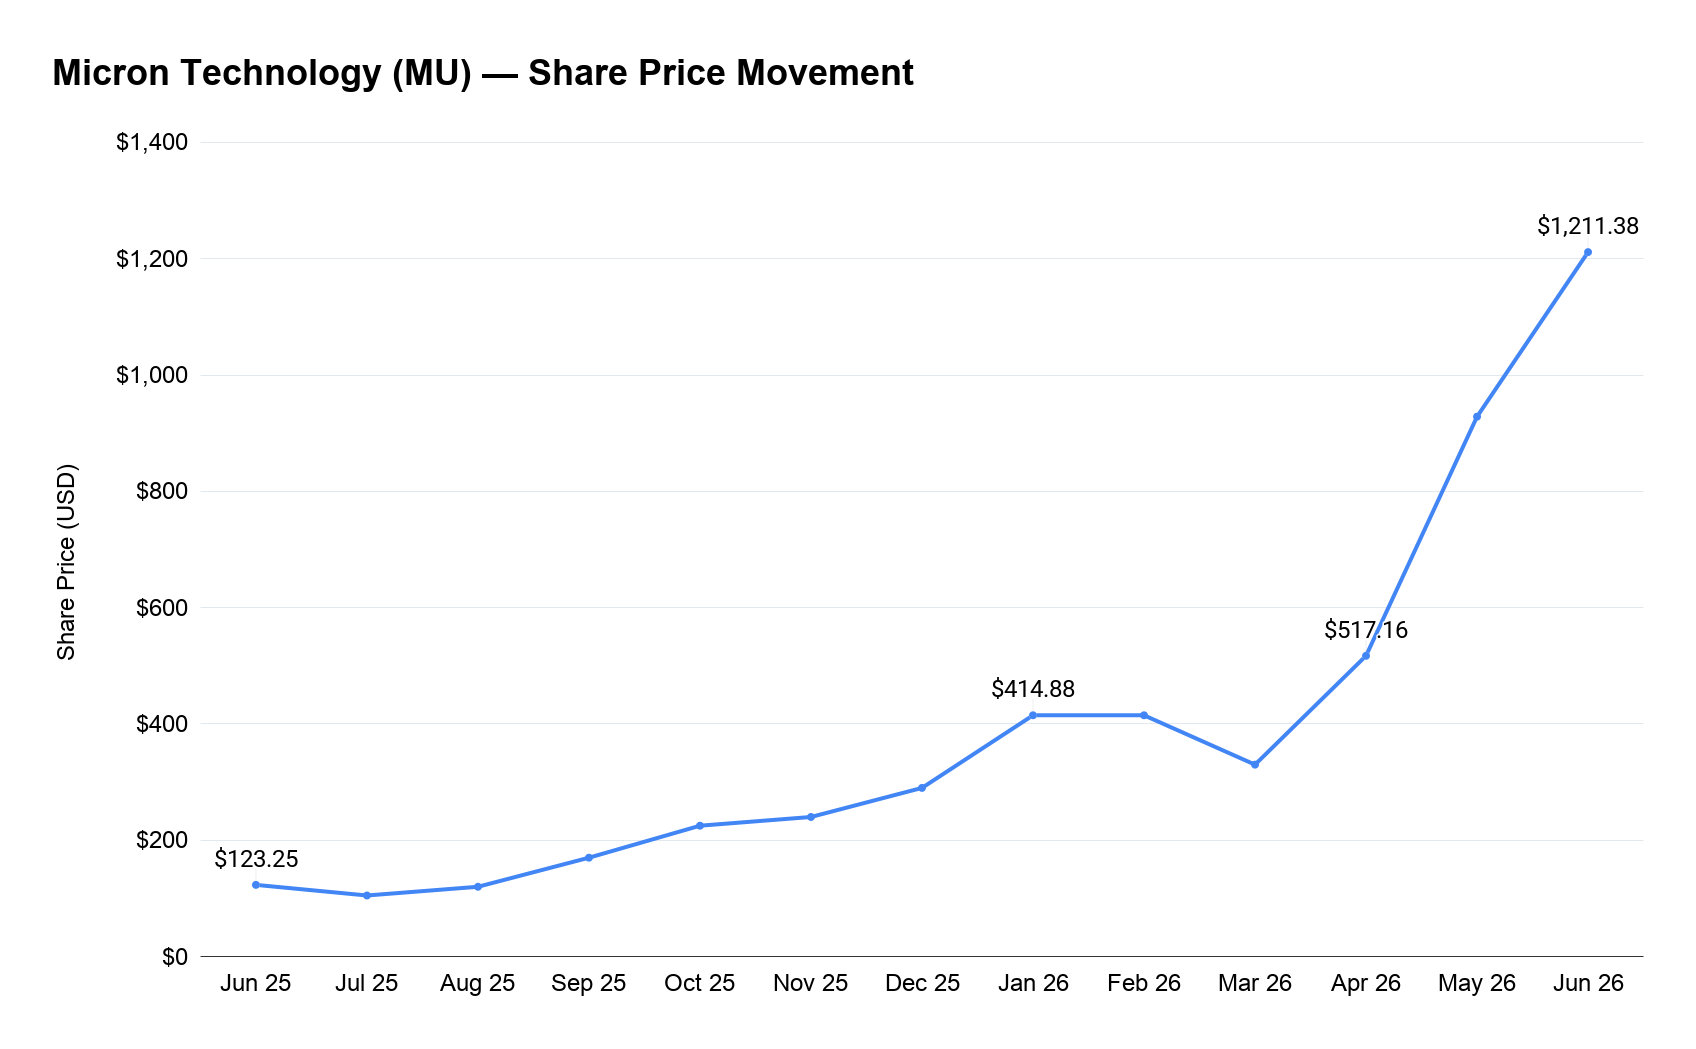
Figure 2: Micron Technology (MU) Share Price Evolution
Source: Stock price data: Nasdaq / Yahoo Finance / Google Finance
The market narrative is clear enough: investors have re-rated memory exposure as AI infrastructure demand has expanded. Micron has pointed to record results, tight industry supply, and the rising strategic importance of memory in the AI era. High-bandwidth memory, DRAM, NAND, and data-center demand have moved from background semiconductor inputs to central bottlenecks in the AI buildout.
Beyond the Market Narrative: TenderAlpha’s B2B Supply Chain View
But public narratives only tell part of the story. TenderAlpha’s B2B supply chain data brings together cross-border trade flows, direct B2B procurement, service-level transactions, subcontracting, grants, subgrants, and B2B announcements.
Deep dive into the data available on TenderAlpha Pro shows that Micron’s largest cross-border buyer relationships appear concentrated among a handful of major corporate groups:
Together, these buyers point to a concentrated but varied supplier-side footprint, spanning high-value semiconductor-related demand, high-frequency operational flows, and internal cross-border activity.
For investors, this supplier-side buyer view adds a transaction-level layer to the Micron story. It shows where Micron’s cross-border B2B activity is expanding and which buyer relationships appear most important. The data does not prove causation, but it helps make the AI-memory investment narrative more testable by connecting public-market momentum with observable commercial activity.
In addition to cross-border trade flows, TenderAlpha’s B2B supply chain data includes announcements gathered from publicly disclosed company information. These announcements help identify direct partnerships, commercial relationships, and supply-chain links that may not necessarily appear in customs-based cross-border trade flows. For Micron, TenderAlpha’s B2B announcements data highlights relationships with companies such as:
Together, the various components of TenderAlpha’s B2B supply chain data give investors a more granular supplier-side view of Micron – connecting cross-border buyer activity, transaction momentum, and publicly disclosed commercial relationships in one place.
Logistics Analysis: Port-Level Signals Behind Micron’s Cross-Border Activity
Micron has a substantial Asia manufacturing footprint with fabricating operations or locations in China, Singapore, and Taiwan. This regional footprint matters when interpreting TenderAlpha’s supplier-side cross-border B2B trade flows data, because the movement of goods may reflect not only end-buyer demand, but also the structure of Micron’s broader Asia production and logistics network.
TenderAlpha Pro data shows that China, Singapore, and Taiwan account for around 60% of the transactions in which Micron acts as a supplier. Among these, Singapore appears as the export country with the highest number of transactions, reinforcing its role as a key node in Micron’s observed cross-border activity.
The more differentiated insight comes from TenderAlpha’s port-level trade flows data. Country-level trade data can show where a transaction is reported, but port-level data helps reveal the logistics infrastructure behind that flow.
In Micron’s case, port-level data reveals an important logistics detail: some records are labeled with Singapore as the export country, while the reported export port points to Xi’an, China. This suggests that country-level labels alone may not fully capture the physical logistics path behind a transaction. Most of these Singapore/Xi’an records appear in 2021 and 2022, which may point to temporary routing or reporting adjustments during the COVID-era disruption of regional supply chains. TenderAlpha’s port-level visibility therefore helps separate the reported commercial geography from the underlying logistics route.
The same point appears in the Singapore–Vietnam corridor. Between 2021 and 2025, TenderAlpha Pro captures 4,775 cross-border B2B transactions in this corridor, with a total transaction value of nearly $400 million.
Table 1: Micron Supplier-Side Transactions in the Singapore–Vietnam Corridor, 2021–2025
| Year | Singapore-Vietnam transactions | Total Transaction Value |
|---|---|---|
| 2021 | 1,793 | $38.7m |
| 2022 | 212 | $4.4m |
| 2023 | 827 | $36.5m |
| 2024 | 1,025 | $174m |
| 2025 | 918 | $143.5m |
Source: TenderAlpha Pro
Nearly all of these transactions appear to be between Micron and companies from the LG Group, making the corridor especially relevant to Micron’s supplier-side buyer analysis. A notable detail is that roughly one-quarter of the Singapore–Vietnam corridor records appear to reference a Chinese port, again showing why port-level visibility is important when interpreting cross-border flows.
Buyer-Side Signals: India Facility Ramp-Up and Import Sourcing Patterns
While Micron’s supplier-side trade flows help identify observable demand from external buyers, the buyer-side view adds a different layer to the analysis: it shows how Micron itself has been sourcing goods across borders. This is especially relevant in the context of the company’s new semiconductor assembly and test facility in Sanand, India.
TenderAlpha Pro data shows a sharp increase in Micron buyer-side transactions into India ahead of the facility’s opening. Out of 1,006 transactions where Micron acted as the buyer and India was the import country, 906 occurred in 2025. This concentration suggests a significant pre-opening ramp-up in procurement activity, likely connected to facility preparation, production-line setup, testing capability, and early operational readiness.
In the table below, we review the top five HS-code descriptions observed in the Micron buyer-side transactions where India was the import country.
The HS-code distribution is led by semiconductor media: solid-state non-volatile storage devices under HS 852351, which accounts for 160 transactions, or 17.6% of all India-imported transactions in 2025. This is followed by electronic integrated circuits: memories under HS 854232, with 152 transactions, or 16.8%. The next largest categories are electronic integrated circuits: other under HS 854239 at 7.6%, fixed resistors under HS 853321 at 6.1%, and printed circuits under HS 853400 at 5.7%.
Together, the top five HS-code descriptions account for 488 transactions, or 53.8% of the reviewed rows.
Table 2: Top HS-Code Descriptions in Micron Buyer-Side Imports into India
| Rank | HS Code | HS Code Description | Count | Share of total |
|---|---|---|---|---|
| 1 | 852351 | Semiconductor media: Solid-state non-volatile storage devices | 160 | 17.6% |
| 2 | 854232 | Electronic integrated circuits: Memories | 152 | 16.8% |
| 3 | 854239 | Electronic integrated circuits: Other | 69 | 7.6% |
| 4 | 853321 | Other fixed resistors: For a power handling capacity not exceeding 20 W | 55 | 6.1% |
| 5 | 853400 | Printed circuits | 52 | 5.7% |
Source: TenderAlpha Pro
The export-country distribution provides another useful lens on Micron’s India-related buyer-side activity.
Japan leads with 205 transactions, or 22.6% of the reviewed export-country entries, followed by Taiwan with 196 transactions, or 21.6%. China ranks third, with 138 transactions, or 15.2%, followed by Singapore with 116 transactions, or 12.8%, and Malaysia with 94 transactions, or 10.4%.
Table 3: Top Export Countries in Micron Buyer-Side Imports into India
| Rank | Export Country | Count | Share of total |
|---|---|---|---|
| 1 | Japan | 205 | 22.6% |
| 2 | Taiwan | 196 | 21.6% |
| 3 | China | 138 | 15.2% |
| 4 | Singapore | 116 | 12.8% |
| 5 | Malaysia | 94 | 10.4% |
Source: TenderAlpha Pro
Taken together, the buyer-side data supports the view that Micron’s India imports were not isolated or incidental, but part of a broader operational ramp-up ahead of the Sanand facility’s launch.
The concentration of transactions in 2025, the dominance of semiconductor- and electronics-related HS codes, and the sourcing mix across Japan, Taiwan, China, Singapore, and Malaysia all point to India becoming a more visible node in Micron’s cross-border supply chain.
At the same time, the presence of China among the top export countries makes supplier-level and product-level review important, particularly for semiconductor-related goods, printed circuits, integrated circuits, testing equipment, and other sensitive categories.
The supplier breakdown shows meaningful differences in Micron’s buyer-side sourcing patterns across the top three countries of export – Japan, Taiwan, and China.
Taiwan-origin transactions appear the most internally weighted, with Micron-related entities accounting for a large share of the observed supplier names, especially Micron Semiconductor Asia Operations and Micron Memory Malaysia.
Japan presents a more mixed profile: Micron-related entities are present, but the flow is strongly shaped by TOWA Asia Pacific, which appears as the dominant external supplier in the Japan-exported transaction set.
China-origin transactions look different again, with external suppliers making up the clear majority of observed supplier names. These include Avnet Asia, BSD Private Limited, Dynamic Electronics, Simmtech, Tripod, Kinsus, Kulicke & Soffa, ASE Shanghai, Gultech Wuxi Electronics, and others.
Table 4: Supplier Concentration by Export Country
| Export country | Leading supplier pattern | Most visible supplier names |
|---|---|---|
| Japan | Mixed, but dominated by one external supplier | TOWA Asia Pacific; Micron Semiconductor Asia Operations; Micron Memory Malaysia; Micron Semiconductor Xi’an |
| Taiwan | Strongly Micron-related | Micron Semiconductor Asia Operations; Micron Memory Malaysia; Micron Semiconductor Xi’an; Avnet Asia |
| China | Broad external supplier base | Avnet Asia; BSD Private Limited; Dynamic Electronics; Simmtech; Tripod; Kinsus; Kulicke & Soffa; ASE Shanghai; Gultech Wuxi Electronics |
Source: TenderAlpha Pro
The United States is, understandably, a logical final destination for a significant portion of Micron’s buyer-side transactions, given the company’s domestic operating footprint and the role of U.S. sites in its broader manufacturing, R&D, logistics, and corporate network. Japan, India, and Taiwan account for four-fifths of observed origin-country activity, with Japan representing 43.7% of the U.S.-destination records, followed by India at 26.0% and Taiwan at 11.7%.
This pattern is useful when read alongside the India-focused buyer-side data. India appears not only as a major import destination in the Sanand facility ramp-up analysis, but also as a meaningful origin country in Micron’s U.S.-destination flows. That suggests India is becoming more visible in Micron’s wider cross-border sourcing network, rather than appearing only as a recipient of imported equipment and components.
Table 5: Leading Origin Countries in Micron Buyer-Side Transactions with U.S. Final Destination
| Rank | Origin country | Share of total |
|---|---|---|
| 1 | Japan | 43.7% |
| 2 | India | 26.0% |
| 3 | Taiwan | 11.7% |
Source: TenderAlpha Pro
The HS-code mix for U.S.-destination transactions also points to a broad range of goods purchased by Micron. The most frequently observed products include telecom transmission and reception parts, electrical machines and apparatus with individual functions, filtering and purifying machinery, semiconductor manufacturing equipment, and instruments for measuring or checking electrical quantities.
In other words, the U.S.-destination flows appear less concentrated around a single product type and instead reflect a wider mix of semiconductor-related equipment, electrical apparatus, machinery, and testing-related goods.
The point-of-unlading data adds a further logistics layer. Memphis, Tennessee is the largest observed U.S. entry point, accounting for 27.0% of the U.S. unlading records. This is followed by the New York/Newark area at 17.0%, Oakland at 13.2%, New York at 10.3%, and Norfolk at 8.6%.
Together, these five locations account for 76.1% of the U.S. point-of-unlading records, suggesting that Micron’s U.S.-bound buyer-side flows are routed through a relatively focused set of logistics nodes.
Table 6: Leading U.S. Points of Unlading in Micron Buyer-Side Transactions
| Rank | Point of unlading | Share of total |
|---|---|---|
| 1 | Memphis, TN | 27.0% |
| 2 | Newark, NJ | 17.0% |
| 3 | Oakland, CA | 13.2% |
| 4 | New York, NY | 10.3% |
| 5 | Norfolk, VA | 8.6% |
Source: TenderAlpha Pro
For investors tracking AI infrastructure exposure, this level of visibility helps separate broad market narratives from observable company-level activity — showing not only transaction value and buyer relationships, but also HS-code composition, supplier concentration, origin-country patterns, and logistics routes behind Micron’s cross-border B2B flows.
Contact us to request a TenderAlpha Pro demo and explore company-level transaction signals across global buyer-supplier networks.
Disclaimer: This content is for informational purposes only and does not constitute investment advice, a recommendation, or an offer to buy or sell any security.