
Key points:
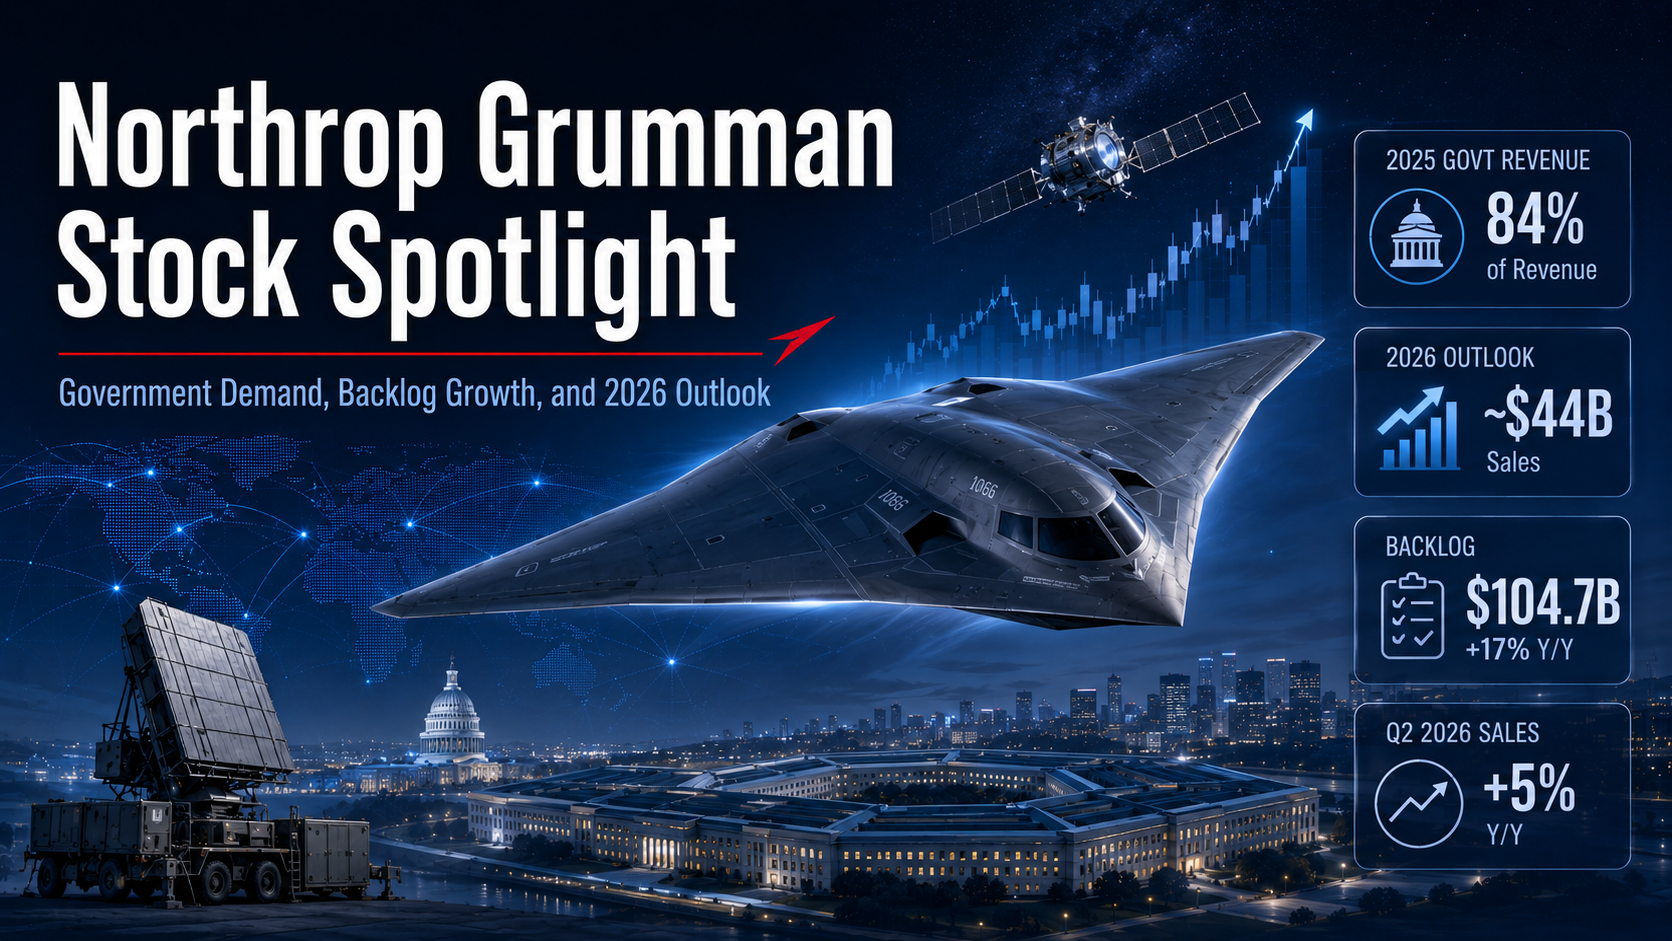
- Northrop Grumman derived 84% of its revenues from the U.S. government in 2025, with government contract awards growing by 6% per year since 2021.
- NOC remains a pillar of the U.S. aerospace and defense ecosystem, working closely with peers such as Lockheed Martin, RTX, and Boeing.
- Despite a mixed Q2 2026 financial performance, NOC hiked its full-year outlook, as recent increases in company-wide backlog point to a period of above-average sales growth.
Before examining Northrop Grumman’s latest financials, let’s first go through the company’s key government customers and business-to-business [B2B] trade flows relationships, which will allow us to get a better idea of the main driving factors behind NOC’s financial performance.
Northrop Grumman’s Major Customers and Trade Flows Counterparties
Activity as a government supplier
Government contracting activity of Northrop Grumman has grown steadily in recent years, reaching a record $19.2 billion in 2024, notwithstanding a small decline to $15.2 billion in 2025. Relative to 2021, government contract awards in 2025 have nevertheless increased by almost 6% per year. With almost $10 billion in government contract awards as of July 2026, NOC looks set to resume its medium-term growth trajectory, as per TenderAlpha global government contracts data:
Table 1: Northrop Grumman government contracting activity, 2021–2026
| Year | Total Value (USD) | Number of Federal Contract Transactions |
|---|---|---|
| 2026 | 9,747,377,966 | 2,550 |
| 2025 | 15,180,426,357 | 4,754 |
| 2024 | 19,172,938,884 | 5,082 |
| 2023 | 18,650,315,419 | 4,794 |
| 2022 | 14,242,316,172 | 4,612 |
| 2021 | 12,075,300,681 | 4,590 |
Northrop Grumman’s revenues grew by roughly 4% annually between 2021 and 2025. Over the same period, award value captured in TenderAlpha’s government contracting data increased by almost 6% per year. Because award value is not equivalent to recognized revenue, this comparison should be read as a directional signal rather than a direct revenue bridge. Even with that caveat, the data points to resilient government demand for NOC over the period.
With NOC disclosing an 84% U.S. government revenue exposure in 2025 (down 1 percentage point relative to 2021), the government award data in Table 1 may also point to a greater role for foreign government awards, including awards captured through subsidiaries. TenderAlpha Pro offers granular records for individual government contracts, including those awarded by foreign governments.
The TenderAlpha platform’s capabilities are particularly useful when assessing which legal entity has been awarded a contract. Table 1 includes government contract awards made directly to Northrop Grumman, as well as awards to its subsidiaries in the United States and around the world.
Among the largest NOC government contracting entities, we see the Department of Defense and its three key military departments, namely:
While military sales account for the vast majority of NOC’s government business, the company also does business with civilian agencies such as NASA and the Social Security Administration.
Business-to-business activity
This context behind Northrop Grumman’s government business is important when we discuss the company’s B2B relationships. Looking through the data on TenderAlpha Pro, we see that NOC is a supplier to a number of aerospace and defense companies, including Lockheed Martin, Boeing, and RTX. Indeed, the data shows that NOC works intensively under subcontracting arrangements with Lockheed Martin and Boeing.
This highlights the interconnected nature of the U.S. aerospace & defense industry, with revenue dynamics at Lockheed Martin and Boeing affecting NOC’s topline growth via the aforementioned subcontracting arrangements.
Turning to Northrop Grumman’s activity as a buyer, we see a particularly intensive relationship with public companies such as RTX, Textron, and General Dynamics. Private companies such as Bechtel Group and Northern Wings Repair also appear prominently among observed NOC supplier relationships.
TenderAlpha data allows investors to study key long-term suppliers of Northrop Grumman. This may be particularly useful for private equity investors looking to invest in suppliers of government contractors such as NOC, as the steady nature of government contract work allows for increased revenue predictability and potentially higher leverage when structuring private equity deals.
Another useful feature of the data available on TenderAlpha Pro is that it allows investors to see whether a business relationship concerns the parent company or its subsidiaries. This functionality is relevant when we want to assess the cumulative exposure a company has to a specific supplier. We should also note that TenderAlpha Pro data allows investors to track intergroup transactions (between the parent and its subsidiaries).
In the case of NOC, we see that Northrop Grumman is a buyer from both the Bechtel Group and its subsidiary Bechtel National. The same applies for Kratos Defense & Security Solutions and its subsidiary Gichner Systems Group. Combining exposures to these entities provides a clearer picture of NOC’s key suppliers.
These relationships are highlighted in Table 2 below, which provides insights derived from TenderAlpha global trade flows data, identifying major counterparties associated with inbound and outbound shipment activity involving Northrop Grumman. Because these records may reflect supplier, subcontractor, partner, logistics, research, or program-related activity, they are best read as indicators of relationship intensity rather than direct measures of procurement spend or recognized revenue.
Table 2: Key B2B counterparties associated with Northrop Grumman trade flows, 2019–2026
| Counterparty | Trade flows profile | Inbound flow | Outbound flow |
|---|---|---|---|
| Lockheed Martin | Inbound and outbound activity | Low | High |
| Boeing | Inbound and outbound activity | Low | Moderate |
| RTX | Inbound and outbound activity | High | Low |
| Bechtel Group | Primarily inbound activity | High | — |
| Textron | Primarily inbound activity | Moderate | — |
From Table 2 above, we observe that Northrop Grumman’s B2B relationships are characterized by a high overlap between NOC suppliers and buyers of NOC products. This is quite typical for the U.S. defense ecosystem, as we observed in our coverage of Boeing and Lockheed Martin.
At the same time, some companies such as Bechtel Group and Textron only feature among NOC suppliers, highlighting the nuanced B2B relationships in the industry. Specific shipment values and shipment counts underlying these relationships are available on TenderAlpha Pro. For investors, these links may be useful as a starting point for identifying counterparties that could be exposed to changes in Northrop Grumman’s production, program activity, and broader defense-industrial demand.
Northrop Grumman’s Financial Performance
Now that we have covered NOC’s government and key B2B relationships, let’s discuss the company’s latest financial developments.
Q2 2026 Financial Results Overview
Northrop Grumman presents results in four reporting segments, namely Aeronautics Systems (principally covering military aircraft systems) at 30% of Q2 2026 revenues, Defense Systems (principally encompassing weapons and deterrent systems) at 18%, Mission Systems (includes information technology products such as radars and sensors) at 28%, with the remaining 24% recorded under Space Systems (principally includes space, missile defense, and launch systems):
Table 3: Results breakdown between segments
| $ in millions, except per share amounts | 2026 | 2025 | Change |
|---|---|---|---|
| Sales | |||
| Aeronautics Systems | $3,519 | $3,114 | 13% |
| Defense Systems | 2,093 | 1,991 | 5% |
| Mission Systems | 3,250 | 3,157 | 3% |
| Space Systems | 2,753 | 2,646 | 4% |
| Intersegment eliminations | (739) | (557) | — |
| Total sales | 10,876 | 10,351 | 5% |
| Operating income | |||
| Aeronautics Systems | 362 | 321 | 13% |
| Defense Systems | 156 | 253 | (38)% |
| Mission Systems | 501 | 441 | 14% |
| Space Systems | 236 | 280 | (16)% |
| Intersegment eliminations | (97) | (76) | — |
| Segment operating income1 | 1,158 | 1,219 | (5)% |
| Segment operating margin rate1 | 10.6% | 11.8% | (120) bps |
NOC reported 5% Y/Y revenue growth in Q2 2026, with the strongest contribution coming from the Aeronautics Systems segment. Despite this solid topline result, operating income declined 5% Y/Y, with the company citing increased investments in the Defense Systems segment and unfavorable estimate at completion (EAC) adjustments in the Space Systems segment.
Coupled with the impact from the non-recurrence of a one-off gain in the prior year quarter, NOC reported EPS of $7.68/share, down 6% Y/Y. On a more positive note, adjusted free cash flow surged 54% Y/Y despite a 31% increase in capital expenditures.
Increased 2026 Outlook
Despite the mixed Q2 2026 performance, NOC hiked its full-year outlook, expecting sales of about $44 billion, up almost 5% relative to 2025, with adjusted EPS seen at about $28.60-29.10/share, a circa 10% increase relative to the prior year.
The more positive outlook is principally driven by stronger sales and margin expectations for the Aeronautics Systems segment. NOC also increased its Mission Systems margin outlook while somewhat reducing its margin expectations for the Space Systems segment in light of the aforementioned EAC adjustments.
Backlog Continues To Grow
The more optimistic outlook for the rest of 2026 is underpinned by NOC’s growing backlog, which reached $104.7 billion at the end of H1 2026, a 17% increase relative to H1 2025, as shown in Table 4 below:
Table 4: Northrop Grumman sales and backlog evolution, 2019–2026
| Year\Indicator | Sales Growth | Backlog Growth |
|---|---|---|
| Q2 2026 | 5% | 17% |
| 2025 | 2% | 5% |
| 2024 | 4% | 9% |
| 2023 | 7% | 7% |
| 2022 | 3% | 4% |
| 2021 | 10% | -6% |
| 2020 | 9% | 25% |
| 2019 | 12% | 21% |
The data in Table 4 shows that NOC’s sales growth has consistently lagged backlog growth since 2024, indicating that the company may see a period of outsized topline growth in the years ahead. This is exactly what happened in 2021, when Northrop Grumman sales surged 10% following two years of double-digit backlog growth, even as company-wide backlog declined by 6%.
In its Q2 2026 report, NOC notes that approximately 35% of the backlog is likely to be realized as revenue over the next year, with the number increasing to 55% if we look two years ahead (i.e., to H1 2028). These percentages are actually somewhat lower than the ones reported by NOC at the end of H1 2025 (40% over the next 12 months and 65% over the next 24 months), indicating that the company’s topline momentum will likely take several years to play out in full.
Conclusion
Northrop Grumman derived 84% of its 2025 revenue from the U.S. government, making it one of the key players in the U.S. aerospace and defense industry. Its government contracting profile and dense B2B relationships reinforce the company’s role as a major node in the defense-industrial ecosystem.
Despite mixed Q2 2026 performance, NOC increased its full-year outlook, underpinned by a 17% increase in the company’s total backlog. With sales only growing at 5% year-over-year, it appears that NOC is likely to enter a period of elevated topline growth as sales slowly catch up to recent backlog developments.
Against this dynamic backdrop, TenderAlpha Pro gives investors transaction-level visibility into Northrop Grumman’s government awards, buyer-supplier relationships, and defense-industrial counterparties, helping users monitor changes in the company’s contracting and supply chain ecosystem.
Contact us to request a TenderAlpha Pro demo and explore company-level transaction signals across global buyer-supplier networks.