
The gap this closes
Private company accounts arrive periodically and often months after the period they describe. Trade does not wait for the filing cycle. B2B transaction records can reach TenderAlpha around 30 days after the underlying activity, so a complete picture of a company’s full year can be readable roughly six to eight weeks after year-end. There is no audit or filing window to wait for.
TenderAlpha’s case study, Seeing Revenue Collapse Before Official Filings, examines what that timing difference looks like in practice. It follows four private product companies whose observed B2B transaction value fell in every year from 2022 to 2025 and compares the transaction record with reported operating revenue where accounts are available.
The practical consequence is the block of time in Figure 1. A full-year transaction view can be available around day 45-60 after year-end, while reported revenue for the same year may not become readable until around day 300. That leaves roughly 240-255 days in which commercial activity can change substantially while the latest filed financial picture remains unchanged.
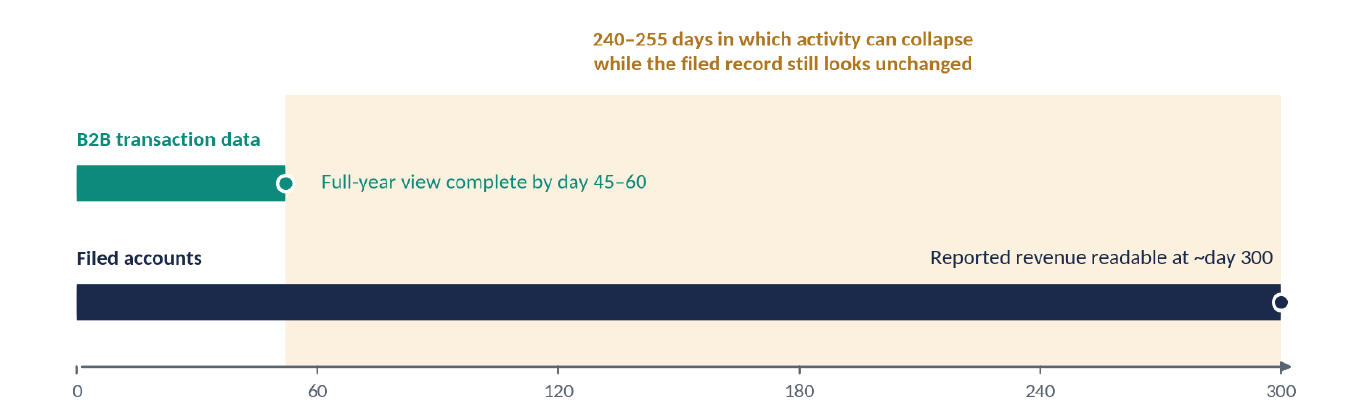
Figure 1: When the transaction record and reported revenue become readable, in days after fiscal year-end.
Source: TenderAlpha Pro
The four companies
All four are private product companies whose observed B2B transaction value fell in every year from 2022 to 2025. Three – D. Navinchandra Gems, Trillion Star and Bright Diam – operate in the diamond trade, where the period coincided with a broader industry contraction. Polytechnyl, a manufacturer of engineering polymers, is a different case: company-specific distress rather than the same end-market story.
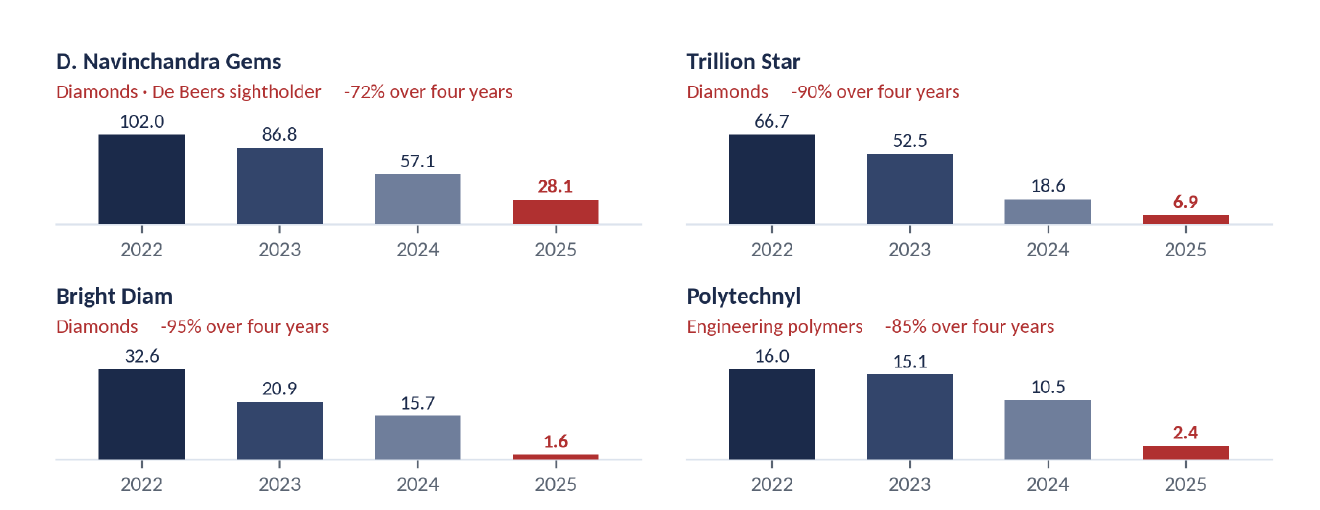
Figure 2: Observed B2B transaction value by year, USD millions. No company has a single up year.
Source: TenderAlpha Pro
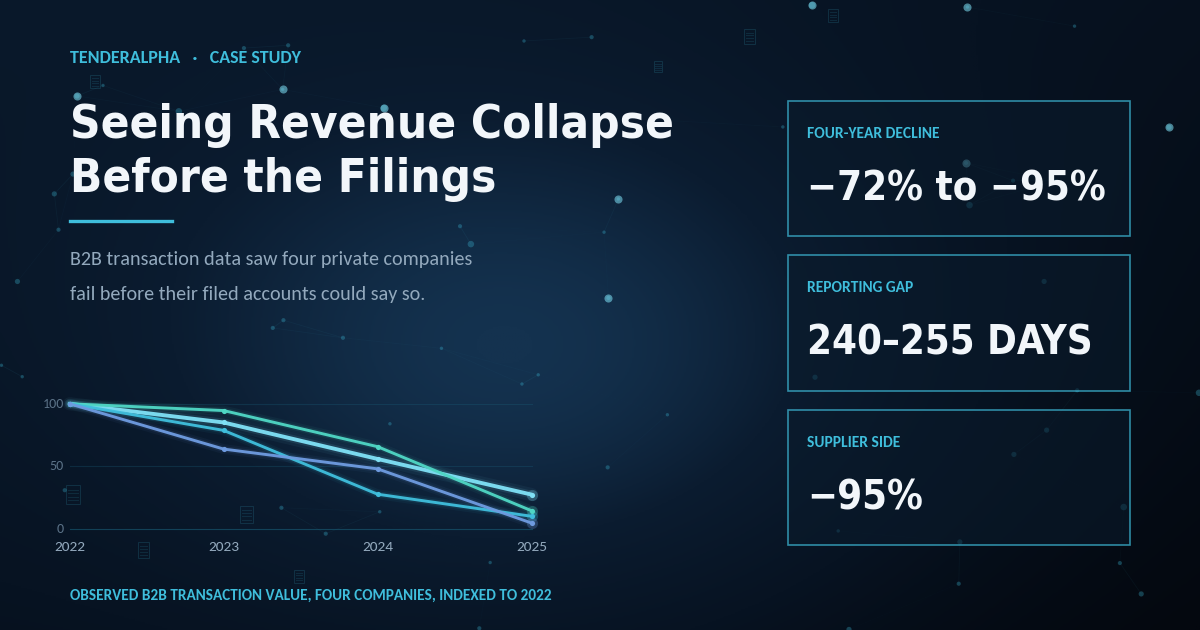
By 2025, observed transaction value was down 72% at D. Navinchandra Gems, 90% at Trillion Star, 95% at Bright Diam and 85% at Polytechnyl versus 2022. For Trillion Star, Bright Diam and Polytechnyl, the 2025 transaction record was already complete while 2025 reported revenue was still unavailable.
Does the signal track the accounts? D. Navinchandra Gems
This is the best-covered company in the set, which makes it the cleanest test. Between 2022 and 2024 the two records move almost in step. Transaction value fell 14.9% in 2023 against reported revenue at 15.0%, then 34.3% in 2024 against 38.2%.
Coverage is expressed through capture rate:
Capture rate = (buyer-side transaction value + supplier-side transaction value) / reported revenue × 100
The figure is coverage density, not an accounting identity: the numerator combines purchases and sales, while reported revenue is one-sided. At D. Navinchandra Gems, capture held between 86% and 91% through 2022-2024, making the series useful quantitatively as well as directionally.
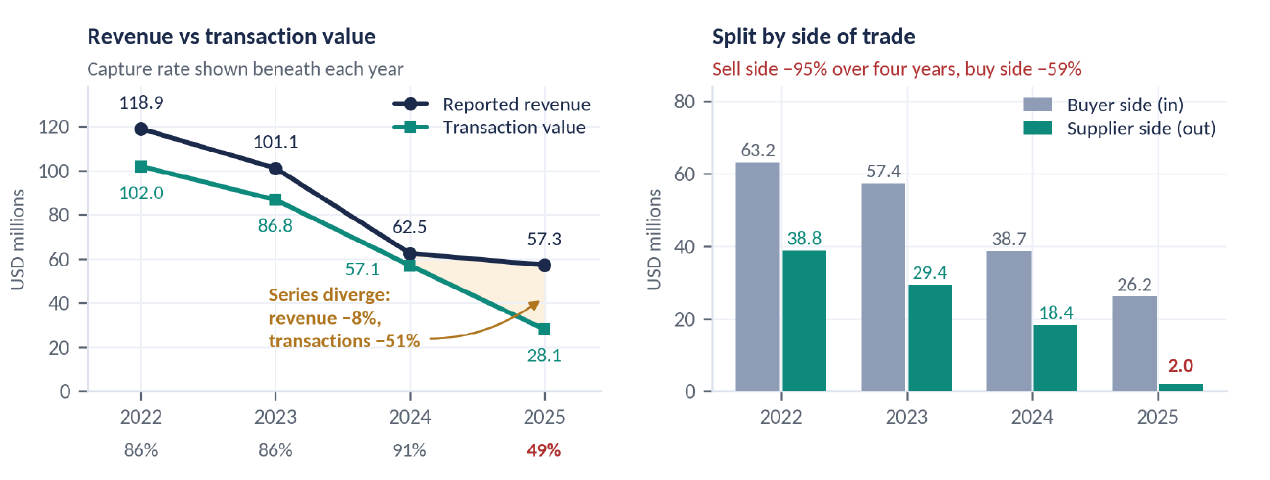
Figure 3: Left: reported operating revenue versus observed transaction value. Right: transaction value split by side of trade.
Source: TenderAlpha Pro
2025 is the year the two series part company. Reported revenue falls 8.4% to $57.3 million. Transaction value falls 50.7% to $28.1 million. That divergence is the alert. It is the year to find out what changed.
Splitting the value by side of trade removes much of the ambiguity. Buyer-side value fell around 59% across the four years. Supplier-side value fell about 95%, from $38.8 million to $2.0 million. Record count barely moved in 2025, down around 7%, but average value per record fell 47% to roughly $9,800. The company remains active in the data; the observed sell side has gone much quieter.
Table 1: D. Navinchandra Gems: reported operating revenue, observed transaction value, capture rate and supplier-side value.
| Year | Reported revenue | Transaction value | Capture | Supplier-side value |
|---|---|---|---|---|
| 2022 | $118.9M | $102.0M | 86% | $38.8M |
| 2023 | $101.1M (-15.0%) | $86.8M (-14.9%) | 86% | $29.4M |
| 2024 | $62.5M (-38.2%) | $57.1M (-34.3%) | 91% | $18.4M |
| 2025 | $57.3M (-8.4%) | $28.1M (-50.7%) | 49% | $2.0M |
Source: TenderAlpha Pro
When there are no accounts at all: Polytechnyl
Polytechnyl is the harder case and the more useful test of low coverage. TenderAlpha observes only around 1% to 2% of its reported revenue by value, so the level of the series says little about the size of the business. The rate of change is the useful signal.
The filed accounts were already weakening. Reported operating revenue fell 36% in 2023, to $745.7 million, then a further 11.5% in 2024, to $659.6 million. But there were no 2025 accounts yet available. In the transaction record, observed value was already down 77.6% in 2025. Receivership opened in January 2026, and the company was later recorded as dissolved.
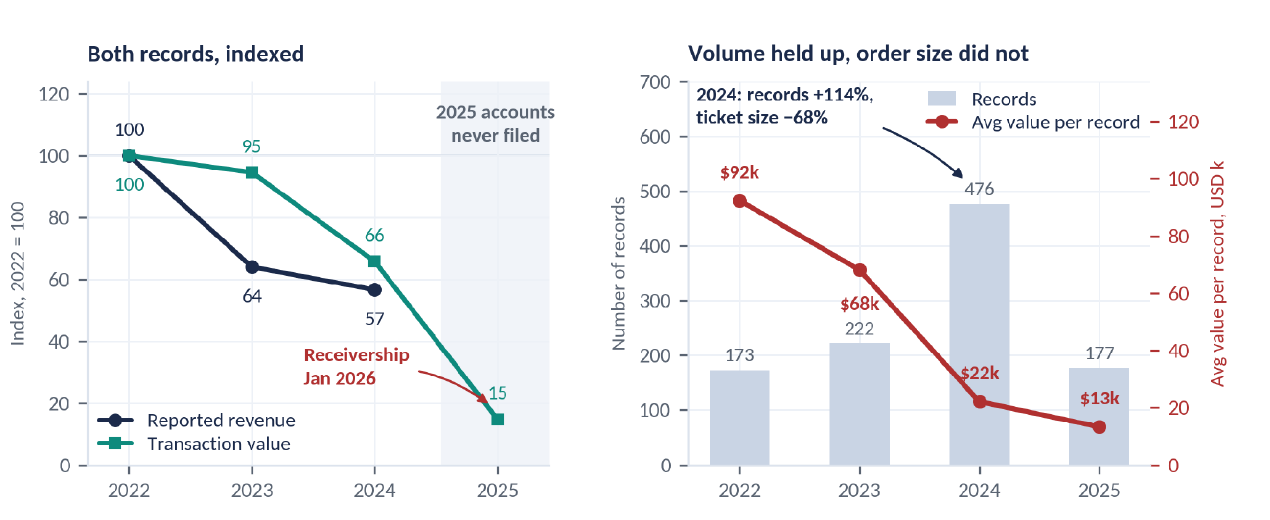
Figure 4: Left: reported revenue and observed transaction value indexed to 2022. Right: record count against average value per record.
Source: TenderAlpha Pro
The 2024 warning is worth isolating because total value alone understates what changed. Observed transaction value fell around 30%, while record count rose 114%, from 222 to 476. Average value per record collapsed from roughly $68,000 to $22,000, then to about $13,000 in 2025. Every Polytechnyl record in this sample is supplier-side, so the observed outbound activity became more numerous but far smaller in value. A count-only screen would have missed 2024; read together, value, count and average ticket date the deterioration much more clearly.
Running this as a monitoring screen
Four cases do not make an indicator. What they do suggest is a sequence, and the order matters more than any single threshold.
In TenderAlpha Pro, users can work with these company-level transaction views, including buyer- and supplier-side activity, transaction values and record counts, as part of ongoing company monitoring.
What the four cases add up to
Across two different settings, the same broad sequence appears: trade turns down, the transaction record shows the change, and the filed accounts confirm part of that deterioration later – or, in Polytechnyl’s 2025 case, have not yet caught up.
B2B transactional data measures observed trade activity, not solvency. It belongs alongside financial accounts rather than in place of them. Companies can shrink deliberately, change their supply chains, exit product lines or route activity through affiliates that are not represented in the same way in the dataset.
The four companies were selected with a known outcome. They illustrate the mechanism; testing it as a systematic screening model requires a broader universe, including companies whose activity later recovered.
Used that way, what the signal adds is time. It gives users a way to revisit company activity while the latest financial statements still describe an earlier period, rather than waiting for the next annual snapshot.
To explore how TenderAlpha’s B2B transactional data can support company monitoring and activity analysis, contact us for access or a tailored demonstration.