
Key Points:
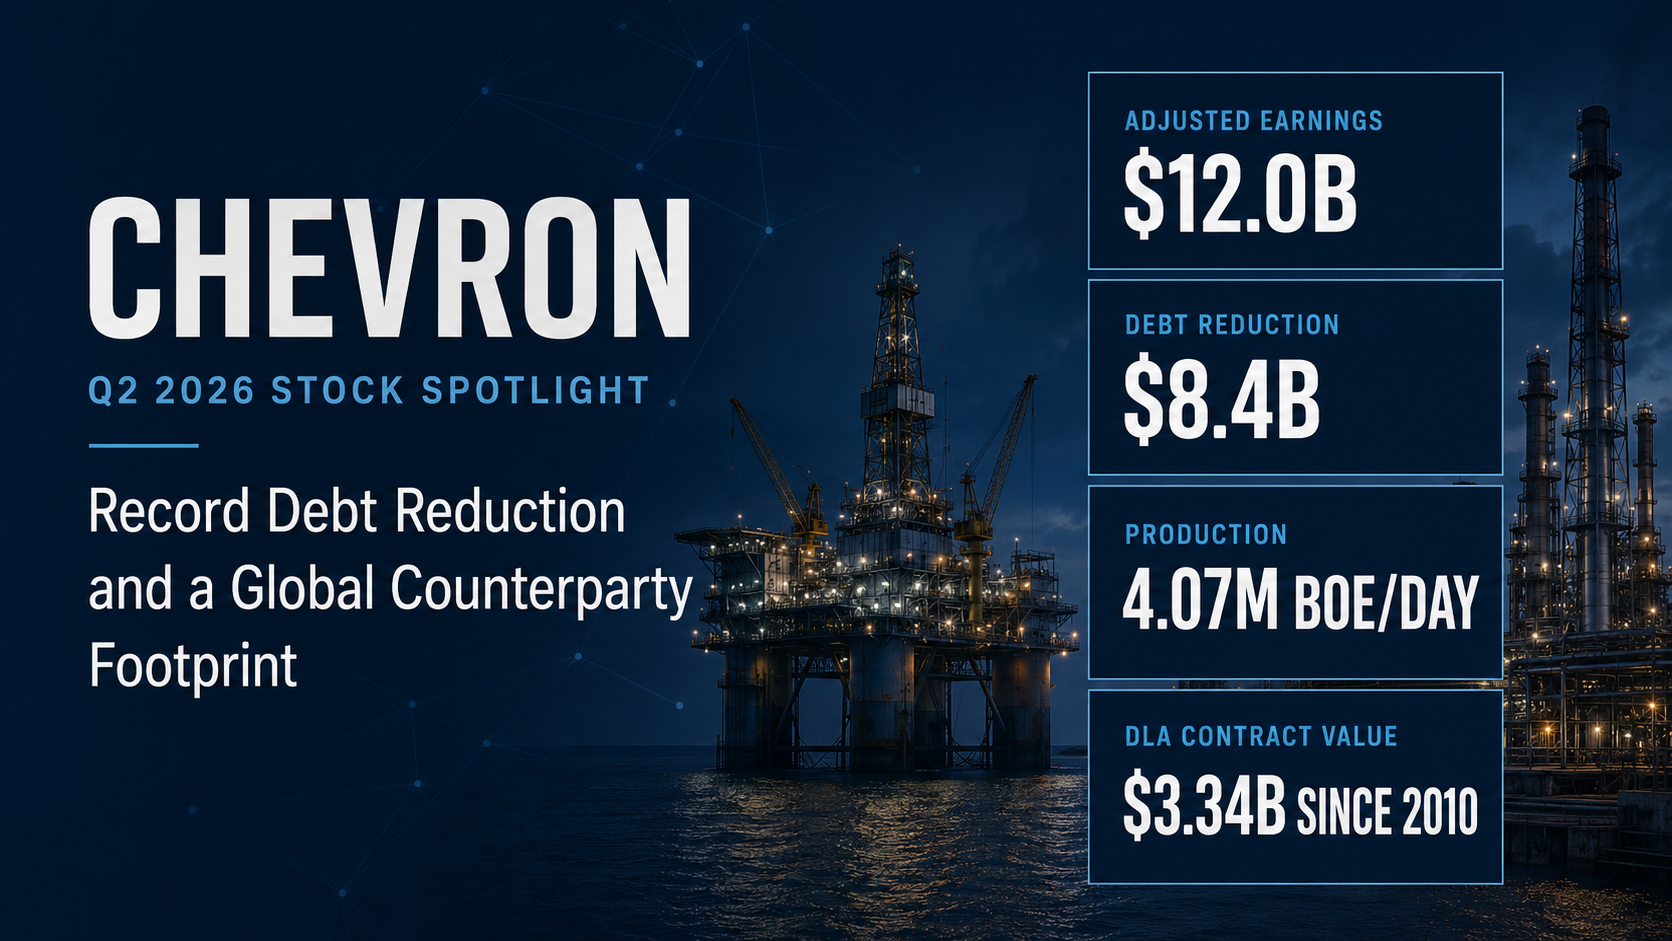
- Chevron reported adjusted earnings of $12.0 billion, or $6.06 per diluted share, in Q2 2026 as higher commodity prices, increased production and stronger refining margins supported results.
- The company reduced total debt by a record $8.4 billion during the quarter, lowering net debt to 0.6 times cash flow from operations and increasing its financial flexibility.
- TenderAlpha trade flows data maps a geographically diverse network of Chevron B2B company relationships, including company affiliates and external counterparties across Kazakhstan, South Korea, India and Peru.
- TenderAlpha Pro records show $281.3 million in Chevron government contract awards during 2026 through August, while records involving the Defense Logistics Agency show approximately $3.34 billion in cumulative contract value since 2010.
Chevron delivered a sharp improvement in earnings and cash generation in Q2 2026, enabling the company to reduce total debt by a record $8.4 billion. Worldwide production also reached a quarterly record following the Hess acquisition and continued growth in the Permian Basin and Gulf of America.
These results strengthened Chevron’s balance sheet at a time when its enlarged production base is changing the scale and geographic composition of the business. TenderAlpha data adds another layer to that financial picture by mapping international trade flows, corporate relationships and government purchasing activity that are not visible in Chevron’s consolidated financial statements.
Read alongside Chevron’s financial results, TenderAlpha records allow investors to monitor how company relationships, geographic exposure and counterparty concentration develop over time, helping identify potential dependencies and changes in commercial activity that merit closer analysis.
Chevron’s Q2 2026 Earnings and Cash Flow
Chevron reported Q2 2026 earnings of $12.1 billion, or $6.11 per diluted share. Adjusted earnings reached $12.0 billion, equivalent to $6.06 per diluted share, compared with $3.1 billion and $1.77 per share in the prior-year quarter.
Table 1: Chevron Q2 2026 earnings and cash-flow summary
| Metric | Q2 2026 | Q1 2026 | Q2 2025 |
|---|---|---|---|
| Reported earnings | $12.1 billion | $2.2 billion | $2.5 billion |
| Adjusted earnings | $12.0 billion | $2.8 billion | $3.1 billion |
| Adjusted diluted EPS | $6.06 | $1.41 | $1.77 |
| Cash flow from operations | $22.6 billion | $2.5 billion | $8.6 billion |
| Adjusted free cash flow | $15.4 billion | $4.1 billion | $4.9 billion |
| Net oil-equivalent production | 4.07 million BOE/day | 3.86 million BOE/day | 3.40 million BOE/day |
Upstream earnings reached $8.2 billion, supported by higher liquids realizations, increased sales volumes and the contribution from legacy Hess assets. Downstream earnings totaled $4.9 billion as refining margins improved, although refined-product sales remained lower year over year.
Chevron also disclosed approximately $1.4 billion of favorable timing effects during the quarter. This is an important qualification when assessing the underlying rate of earnings growth because not all of the Q2 increase should be treated as recurring operating improvement.
Nevertheless, the quarter produced substantial cash flow. Chevron generated $22.6 billion in cash flow from operations and $15.4 billion in adjusted free cash flow. That enabled the company to reduce total debt by a record $8.4 billion while continuing to fund capital investment, dividends and share repurchases.
Net debt declined to 0.6 times cash flow from operations, compared with 1.3 times at the end of Q1 2026. The stronger balance sheet gives Chevron greater flexibility across organic investment, shareholder distributions, debt management and future portfolio decisions. It does not, by itself, indicate that another major acquisition is imminent.
Trade Flows Data Maps Chevron’s B2B Company Relationships
TenderAlpha’s global trade flows data maps Chevron’s B2B company relationships by identifying companies associated with inbound and outbound shipment activity.
A significant portion of the observed activity concerns petroleum products moving between countries. Product classifications, shipment direction and counterparty information help analysts examine the company relationships and geographies surrounding those flows.
TenderAlpha records also show substantial activity involving Chevron affiliates. TenderAlpha’s entity resolution capabilities help distinguish flows involving Chevron affiliates from external company relationships, creating a clearer view of Chevron’s wider business network.
Table 2: Selected counterparties associated with Chevron trade flows, 2019–August 2026
| Counterparty | Recorded flow pattern | Relationship context |
|---|---|---|
| TOO Tengizchevroil | Primarily inbound activity | Chevron 50%-owned affiliate in Kazakhstan |
| GS Caltex | Primarily inbound activity | Chevron 50%-owned affiliate in South Korea |
| Indian Oil Corporation | Primarily outbound activity | Listed Indian energy company |
| Refinería La Pampilla S.A.A. | Primarily outbound activity | Peru-based refining company belonging to the Repsol group |
The relationship context is particularly important for Tengizchevroil and GS Caltex. Chevron owns 50% of both companies, meaning their appearance in the records provides visibility into flows involving two major affiliates within Chevron’s international corporate network.
Tengizchevroil connects Chevron with large-scale production activity in Kazakhstan, while GS Caltex operates an extensive refining and petrochemicals business in South Korea. Monitoring these company relationships over time can help show how activity involving important affiliates develops alongside Chevron’s changing production and operating footprint.
The outbound activity involving Indian Oil Corporation and Refinería La Pampilla provides another view of Chevron’s international reach. The direction, frequency and persistence of these flows provide a basis for monitoring the commercial relationships, while additional company information helps analysts assess each counterparty’s role and financial importance.
TenderAlpha also records activity involving both Indian Oil Corporation and its subsidiary, Chennai Petroleum Corporation. Connecting parent and subsidiary records gives analysts a more complete view of the corporate group’s relationship with Chevron. Careful entity resolution helps bring related activity into the same analytical picture while maintaining visibility at the individual-company level.
The records are not limited to major petroleum-product flows. TenderAlpha also contains lower-volume activity involving industrial-parts entities such as Baker Hughes de Colombia, which the platform connects with the publicly listed Baker Hughes group.
For investors and market-intelligence professionals, this company relationship data helps identify B2B relationships that merit further investigation. Changes in shipment direction, product type, geographic concentration or relationship intensity can be assessed alongside production and financial results, contributing to the monitoring of supplier and buyer relationships and potential supply chain dependencies over time.
Production Reaches a New High Following Hess
Chevron’s worldwide net oil-equivalent production reached 4.07 million barrels per day in Q2 2026, an increase of 20% from the prior-year period. The company attributed the growth primarily to the Hess acquisition and higher production in the Permian Basin and Gulf of America.
Average production for the first half of 2026 was approximately 3.97 million barrels per day, the company’s highest level over the period covered below.
Table 3: Chevron net oil-equivalent production, 2016–H1 2026
| Period | Million BOE/day |
|---|---|
| H1 2026 | 3.97 |
| 2025 | 3.72 |
| 2024 | 3.34 |
| 2023 | 3.12 |
| 2022 | 3.00 |
| 2021 | 3.10 |
| 2020 | 3.08 |
| 2019 | 3.06 |
| 2018 | 2.93 |
| 2017 | 2.73 |
| 2016 | 2.59 |
Chevron ended 2025 with approximately 10.6 billion barrels of net oil-equivalent proved reserves. The Hess acquisition contributed substantial reserve additions in North Dakota and Guyana, while Chevron reported a one-year reserve-replacement ratio of 158% for 2025. Its ten-year reserve-replacement ratio was 95%.
The production trend therefore merits a more nuanced interpretation than assuming that an enlarged production base will necessarily lead to another acquisition. The variables to monitor are whether Chevron can sustain production growth, replace produced reserves and convert the enlarged asset base into durable free cash flow.
Chevron also reported $1.5 billion in annual run-rate Hess synergies within one year of completing the transaction, exceeding its initial target. Future production performance and further synergy delivery will help determine how effectively the acquisition strengthens Chevron’s longer-term operating profile.
The company relationships identified through TenderAlpha’s trade flows data provide context for this operating expansion. Monitoring activity involving relevant affiliates, external counterparties and geographies can help investors assess how Chevron’s wider commercial network develops as its production profile evolves.
Government Awards Provide a Smaller but Measurable Signal
TenderAlpha Pro provides an additional view of Chevron through government contracting records associated with the company.
Table 4: Chevron government contracting activity, 2021–August 2026
| Year | Recorded Award Value (USD) | Number of Records |
|---|---|---|
| 2026 YTD | 281,295,940 | 90 |
| 2025 | 241,957,878 | 199 |
| 2024 | 170,679,444 | 141 |
| 2023 | 191,349,556 | 147 |
| 2022 | 174,392,337 | 175 |
| 2021 | 50,603,530 | 149 |
Recorded award value reached $281.3 million during 2026 through August, exceeding the $242.0 million recorded for the whole of 2025. At the same time, the number of records remained substantially lower than in 2025.
The higher value across fewer entries indicates that recorded activity was more concentrated in larger awards during 2026, making the composition and timing of subsequent awards an important variable to monitor.
The Defense Logistics Agency stands out in Chevron’s longer-term government-contracting history. TenderAlpha Pro records associated with Chevron and the agency show approximately $3.34 billion in cumulative recorded contract value from 2010 through August 2026. The underlying activity includes petroleum products, distillates and storage services.
This longer time series provides a more meaningful view than any single year. It shows that Chevron has maintained a substantial, recurring relationship with a major U.S. government energy buyer, even though annual government awards remain small relative to the scale of Chevron’s overall business.
For context, Chevron reported approximately $185 billion in sales and other operating revenues in 2025. The $242.0 million in government awards recorded by TenderAlpha for that year is small relative to Chevron’s overall commercial scale, but the two figures are not directly comparable. Government awards may cover multiple years or represent contract ceilings, whereas Chevron’s reported sales reflect recognized accounting revenue.
The value of the government-contracting records therefore lies less in estimating Chevron’s revenue mix and more in identifying public-sector buyers, purchasing patterns and contract types. These records can provide a measurable commercial-activity signal without being treated as a substitute for Chevron’s financial disclosures.
What to Monitor Next
Commodity prices, refining margins and timing effects
Chevron’s Q2 results benefited from higher commodity prices, stronger refining margins and approximately $1.4 billion of favorable timing effects. Subsequent quarters will show how much of the earnings and cash-flow improvement persists under different market conditions.
Production and Hess integration
Worldwide production reached a record level, while Chevron reported $1.5 billion in annual run-rate Hess synergies. Investors should monitor production volumes, integration costs, operating reliability and further synergy delivery.
Reserve replacement and capital allocation
Chevron’s enlarged production base increases the importance of replacing produced reserves over time. Reserve additions, project approvals, organic investment and any portfolio transactions should be evaluated together rather than treating another acquisition as a predetermined outcome.
Trade flows and counterparty activity
Relevant TenderAlpha indicators include changes in inbound and outbound shipment patterns, geographic concentration, product classifications and activity involving major affiliates or external counterparties. Monitoring these company relationships over time can help identify changes in relationship intensity, concentration and potential dependencies.
Government award activity
The value, frequency and composition of government awards can help show whether the recent increase is sustained and whether Chevron’s relationship with agencies such as the Defense Logistics Agency is expanding, contracting or changing in character.
Conclusion
Chevron’s Q2 2026 results combined substantially higher earnings, record production and a record $8.4 billion reduction in total debt. The company’s stronger balance sheet increases its financial flexibility, while continued production growth, reserve replacement and Hess synergy delivery will determine whether the improved operating performance proves durable.
TenderAlpha data adds context that is not available from Chevron’s consolidated results alone. Trade flows data maps activity involving major affiliates and external counterparties across several energy markets, while government-contract records identify public-sector purchasing activity—including approximately $3.34 billion in cumulative recorded contract value involving the Defense Logistics Agency since 2010.
Used alongside company disclosures, TenderAlpha’s transaction-level data can help investors monitor the persistence and direction of B2B company relationships, geographic exposures, counterparty concentration and potential dependencies over time.
Request a TenderAlpha Pro demo to explore transaction-level government-contracting and trade flows data for Chevron and other publicly listed companies.
This article is provided for informational purposes only and does not constitute investment advice, a recommendation to buy or sell securities, or an assessment of the suitability of any investment. Readers should conduct their own research and consult an appropriate professional adviser before making investment decisions.