
When you want to understand a company’s supply chain, filings are the usual starting point. They give you a handful of named customers, a few key suppliers and a risk factor or two. It’s a list, and it stops where disclosure stops.
TenderAlpha’s Supply Chain Graph starts from the records instead. It’s built from four sources: global trade flows from customs and shipping records, corporate procurement, government subcontracting, and publicly announced commercial relationships. The trade data shows what physically moved between companies. Subcontracts, corporate procurement and announced relationships add the links that do not appear as a shipment.
Every record is an edge
Each record carries:
- The buyer and the supplier
- The product: an HS code for shipments, an industry code (NAICS) for corporate procurement, subcontracts and announced deals
- The date of the transaction
- Tickers for listed companies, mapped at parent and subsidiary level
So the graph has two ways in: start from a company, or start from a product.
Start from a company
Who does it really buy from, and who buys from it? Filings typically name only the customers large enough to disclose, often those above 10% of revenue. Transactions don’t wait for a materiality threshold. The smaller customers, the second-source suppliers and the subsidiary that does the actual importing all show up as edges.
Follow those edges outward and you get tiers: the company’s suppliers, then their suppliers, then one step further. Tiers aren’t a separate dataset. They’re the same graph, walked from the company you care about.
Start from a product
Pick an HS code and the graph shows who ships it, who buys it and which listed companies sit at each end. You can see where a product is sourced, how concentrated that sourcing is, and when buyers move from one supplier or origin country to another.
Two quick examples
Following a product: chips into Vietnam
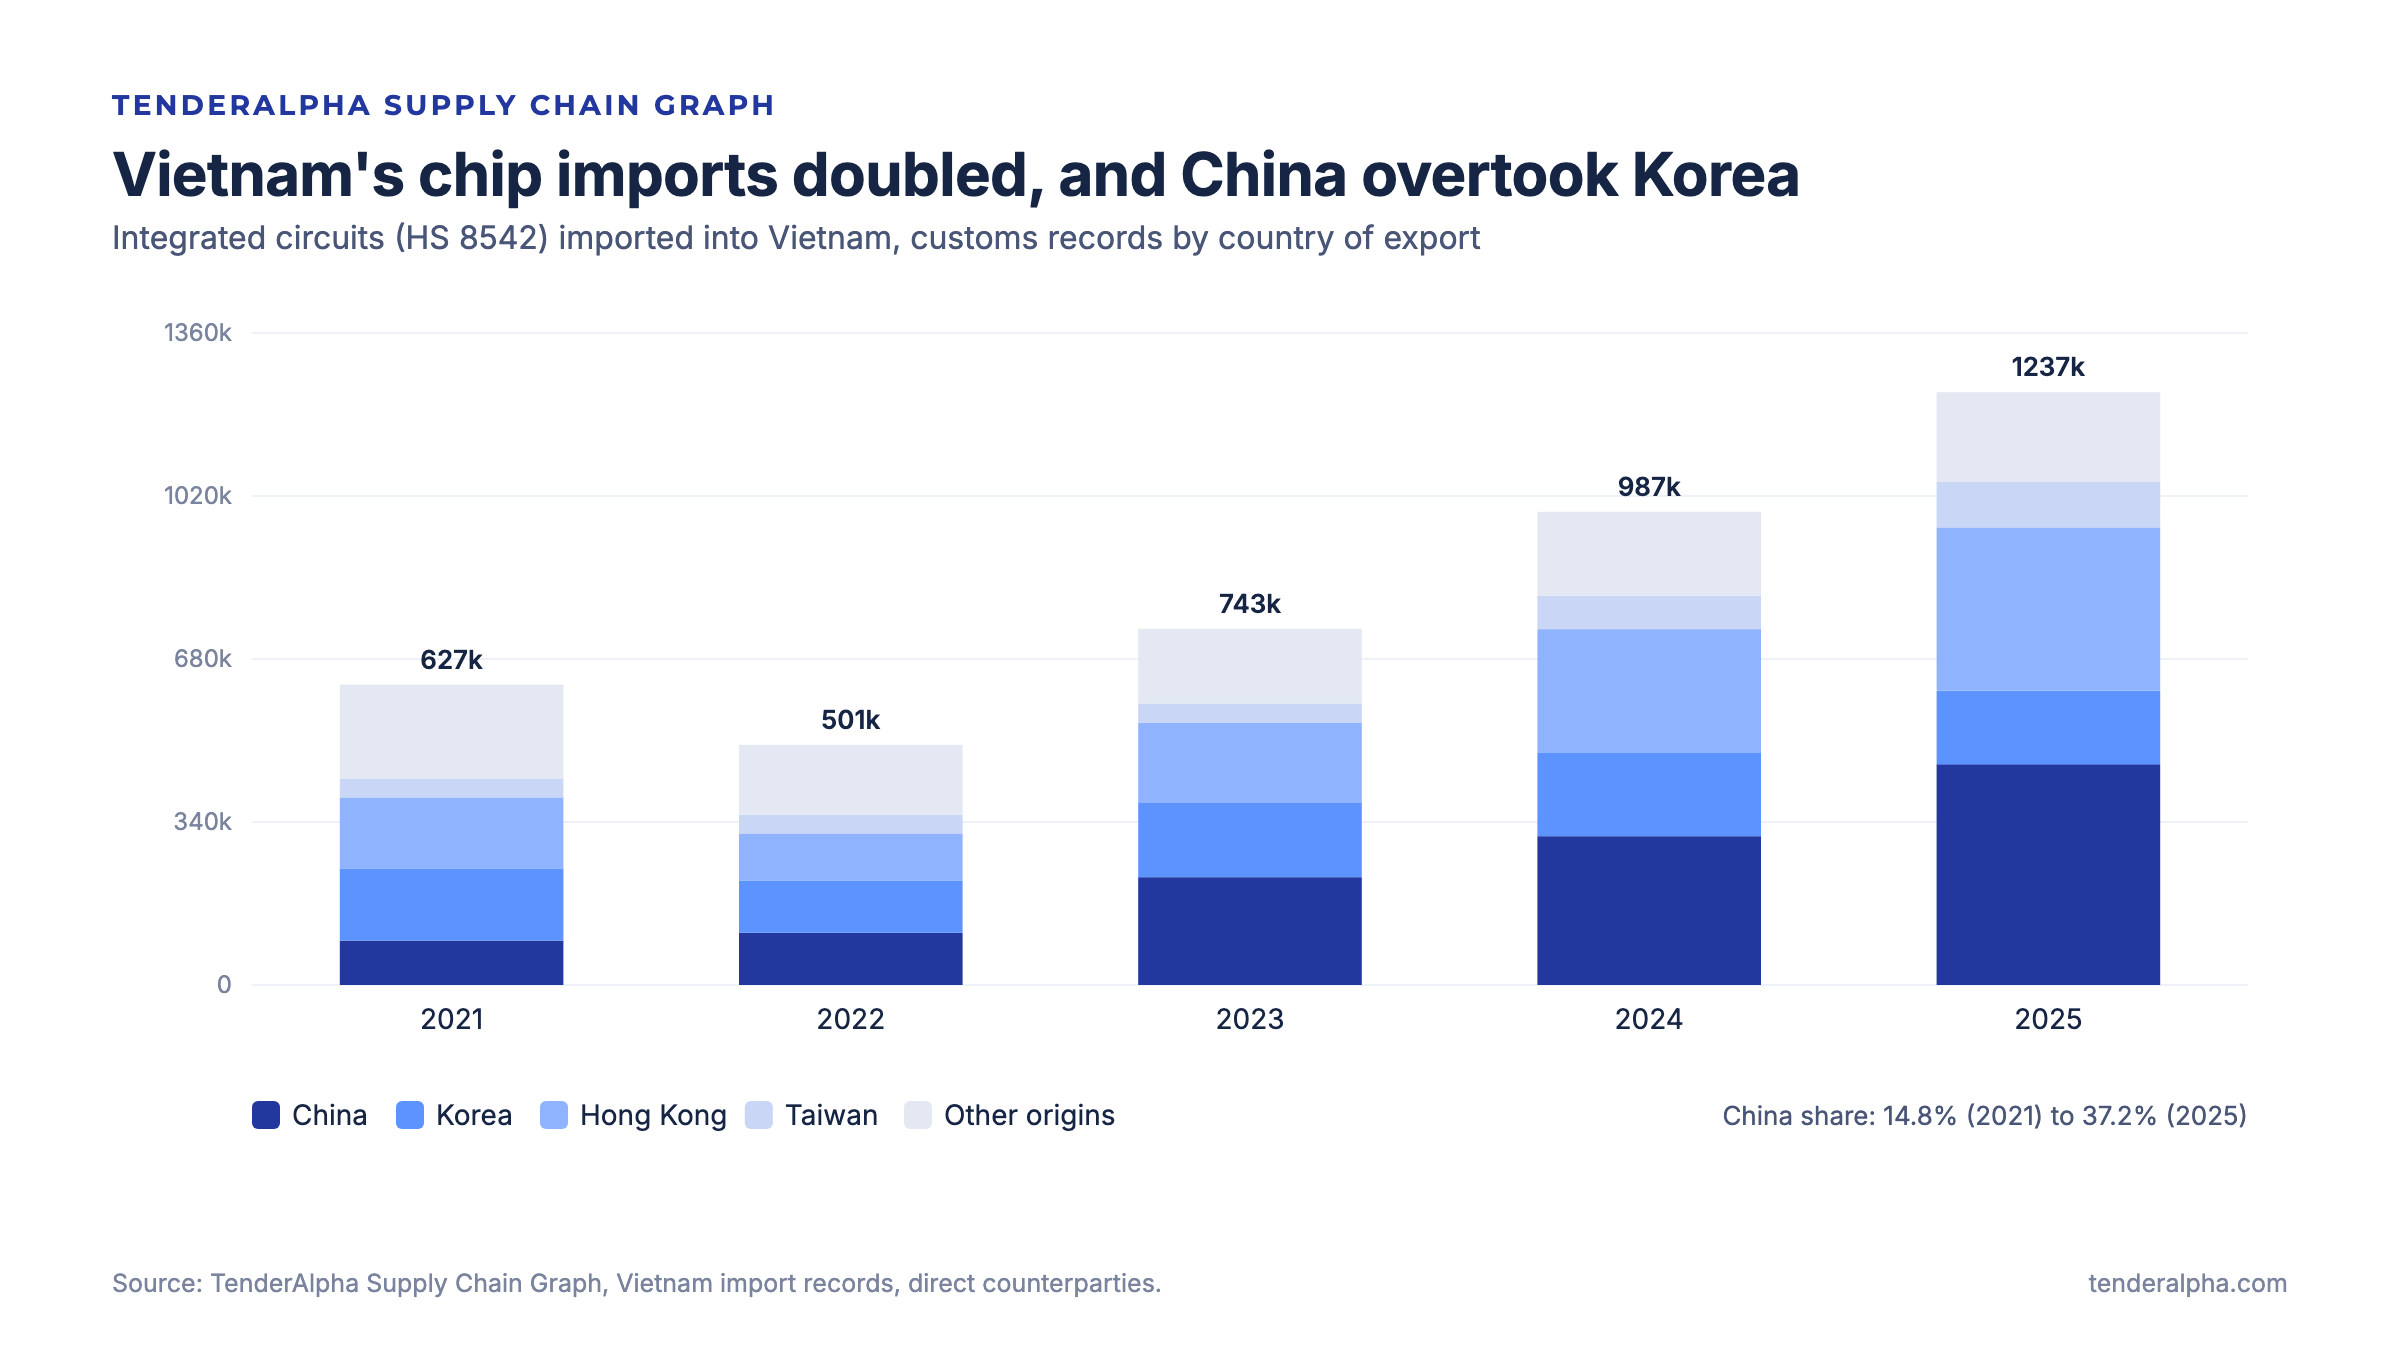
Vietnam’s imports of integrated circuits (HS 8542) roughly doubled, from about 630,000 customs records in 2021 to about 1.24 million in 2025. Where they come from changed even more. China’s share of the records rose from 15% to 37%, overtaking Korea, whose share halved from 24% to 12%.
Following a company: Amkor’s plant in Vietnam
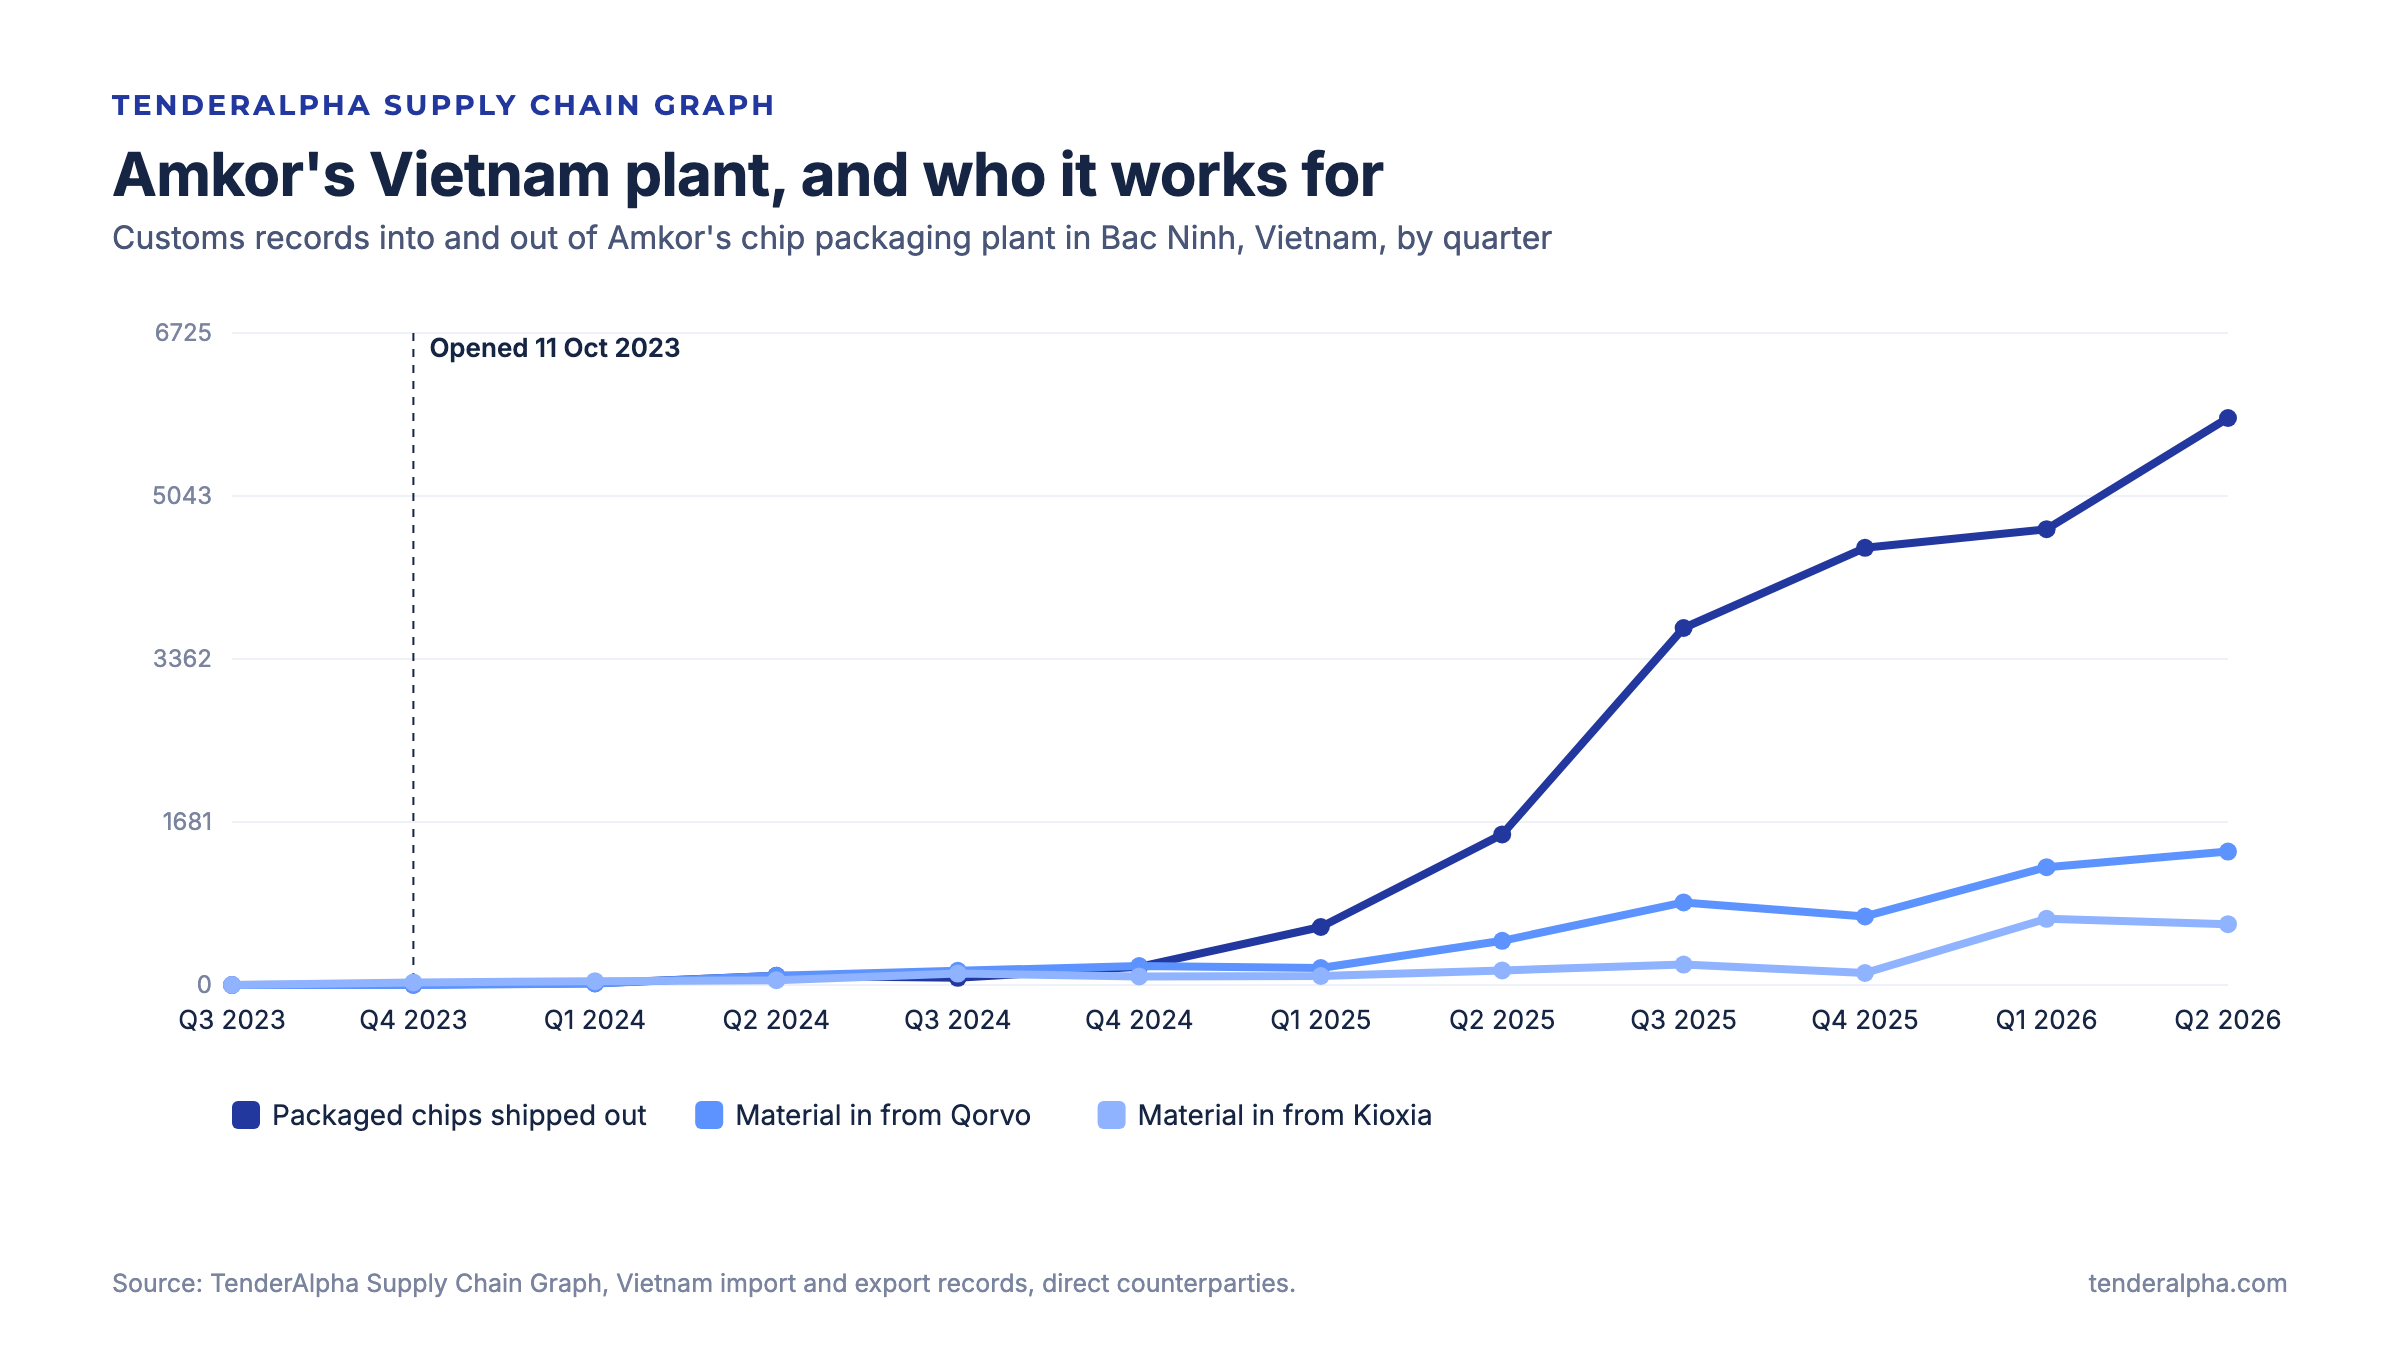
Amkor opened its chip packaging and test plant in Bac Ninh, Vietnam, on 11 October 2023. It said the site would focus on system-in-package and memory, but didn’t say who for. The graph shows who it works for: two names appear on both sides of the plant’s trade. Qorvo ships in the parts for radio-frequency modules (filters, capacitors, inductors and amplifier chips) from China, Korea and Costa Rica, and finished parts go back out to Korea. Kioxia ships memory chips in from Japan, and packaged memory goes back to Japan. Chip exports from the plant went from four records in its first quarter to almost 6,000 in the second quarter of 2026.
Built for research
The graph goes back to 2019, updates daily, and arrives as an edge list ready to load into a graph database or knowledge graph, with buyers and suppliers already matched to company records.
Potential use cases
- Read-through: reading a supplier’s business through what its customers are buying, and the reverse.
- Customer and supplier discovery: relationships below the disclosure line, including ones neither company has mentioned.
- Concentration and dependency: companies that rely on a single supplier, product or country of origin.
- Product flows: who gains or loses share in a product as sourcing moves.
- Knowledge graphs: a company-to-company and company-to-product base layer for research platforms and AI agents.
Getting the data
The graph is delivered as daily files to S3 or SFTP, in CSV or Parquet. Get in touch and we’ll show you the graph around the companies and products you follow.