
Back to Blog

Unlocking Alpha in Government Contracts

Dimitar Georgiev
31 Oct, 2025
5 min read
Unlocking Alpha in Government Contracts

Key Findings

Longer-Term Receivables Matter

Sorting firms by their longer-term receivables (for example, 60-month receivables minus 12-month or 36-month) helps isolate companies with newer or growing contract portfolios. This adjustment distinguishes new business from legacy receivables.

Strong Sharpe Ratios

The signal shows promising Sharpe ratios for equal-weighted portfolios:

  • Between 0.77 and 0.88 when scaled by assets
  • Up to 1.0 when normalized by sales
Signal Quality

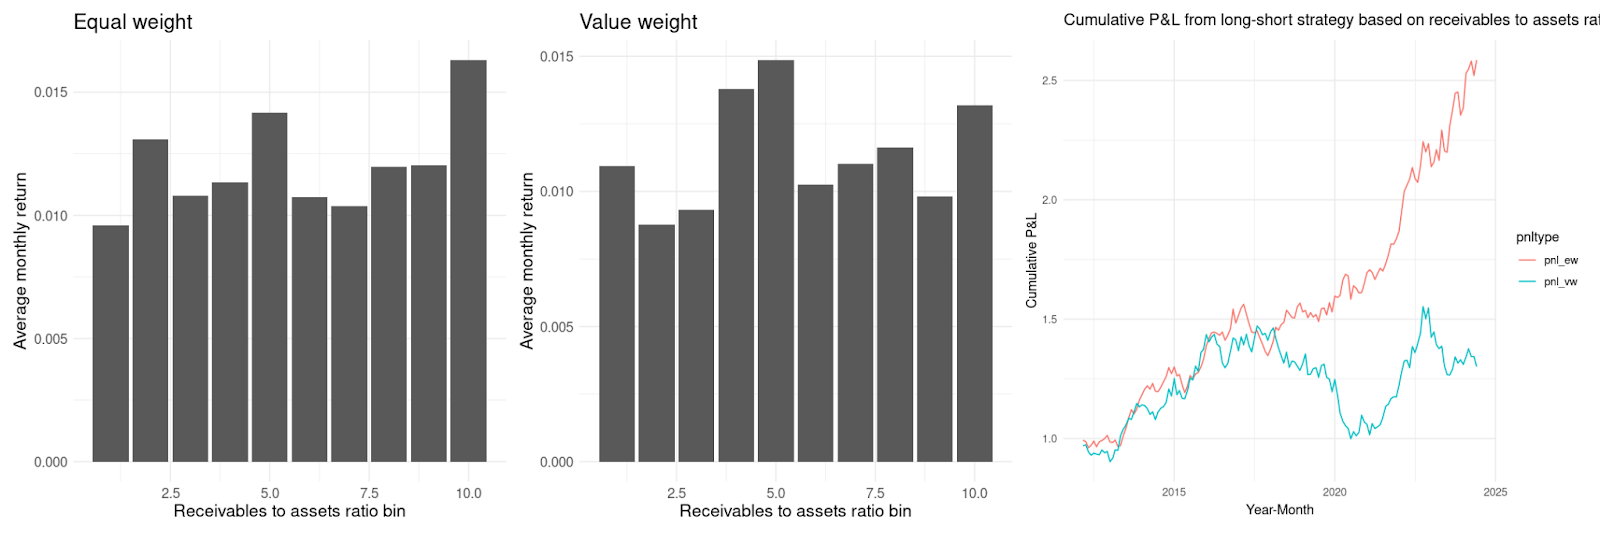
Fig. 1 and Fig. 2 illustrate the performance of portfolios sorted by adjusted receivables signals. The first chart shows the results using the 60-month minus 12-month receivables divided by sales, which delivers a Sharpe ratio of 0.77 for value-weighted portfolios and 0.88 for equal-weighted portfolios, highlighting stronger performance among smaller, less-followed companies. The second graph uses the 60-month minus 36-month approach, which refines the signal further and produces an even stronger Sharpe ratio of 1.0 for equal-weighted portfolios. Both charts demonstrate that isolating newer, longer-term government contracts can uncover underpriced equity opportunities.
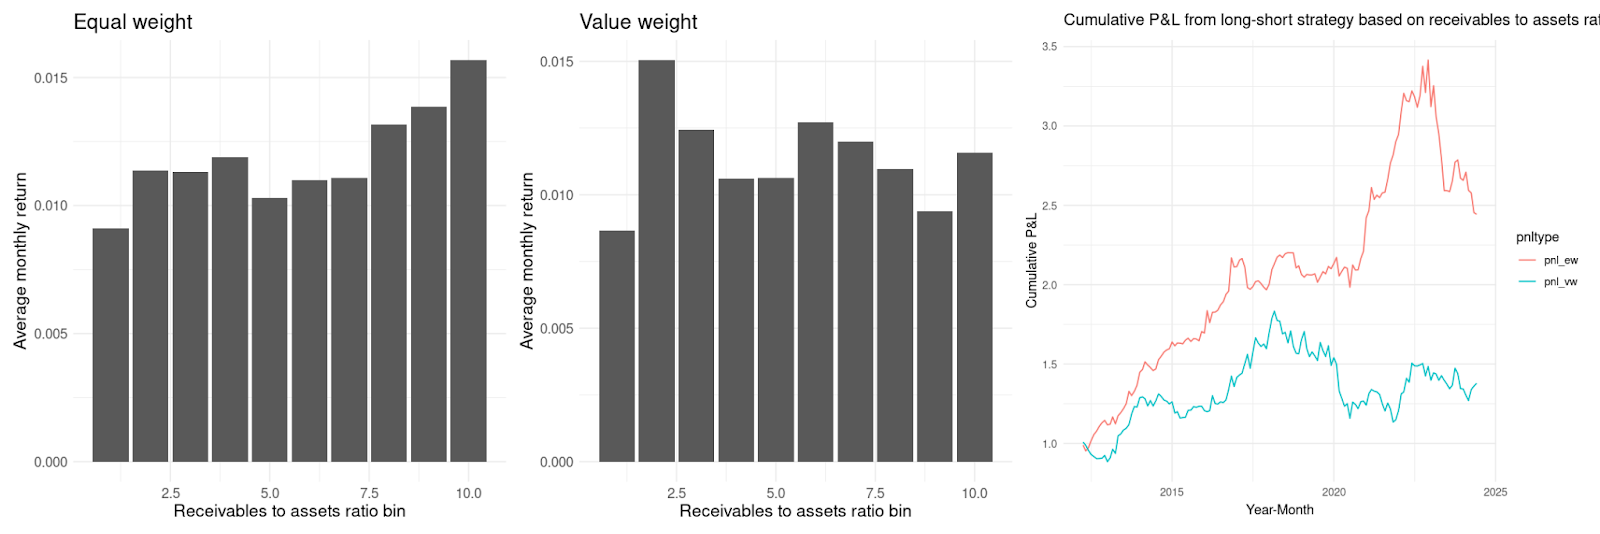
(60-month forward-looking receivables - 12-month forward-looking receivables) / sales
Fig. 1. (60-month forward-looking receivables − 12-month forward-looking receivables) / sales

(60-month forward-looking receivables - 36-month forward-looking receivables) / sales
Fig. 2. (60-month forward-looking receivables − 36-month forward-looking receivables) / sales
Undervalued Segments

The effect is stronger for small and mid-sized firms, which aligns with the idea that these companies receive less attention from the market. Value-weighted portfolios show weaker results, reinforcing the opportunity in smaller-cap names.
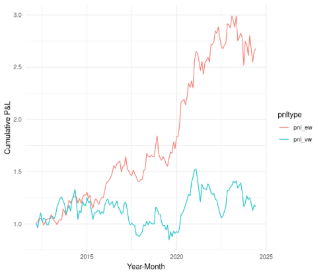
Small-Midsize firms (low-sales): Cumulative P&L from long-short strategy based on receivables-to-assets ratio
Fig. 3. Small-Midsize firms (low-sales): cumulative P&L from long-short strategy based on receivables-to-assets ratio
Big companies (high-sales): Cumulative P&L from long-short strategy based on receivables-to-assets ratio
Fig. 4. Big companies (high-sales): cumulative P&L from long-short strategy based on receivables-to-assets ratio

Additional Methodology Notes

  • Universe of Stocks Considered: US liquid stocks, defined as those trading above $5, with a market capitalization of at least $100M, and an average daily trading volume above $1 million.
  • Treatment of Zero or Missing Receivables: Companies with zero or missing receivables are excluded from the analysis.
  • Strategy Construction: The long/short strategy shown is long the top bucket and short the bottom bucket of the receivables-based signal.
RELATED INTELLIGENCE

Continue Reading

G2B Sales Pulse: Public-Sector Commercial Signals: 5 Awarded Contracts and 3 Open Tenders Worth Monitoring (15-19 June 2026)

This edition of G2B Sales Pulse covers awarded government contracts and open tenders across rail infrastructure, fleet electrification, government connectivity, financial IT, border surveillance, energy procurement, waste-to-energy concessions, and gas distribution. The selected items show where public-sector buyers are committing capital, where suppliers are gaining position, and where upcoming procurement windows may create commercial opportunities for operators, technology providers, infrastructure investors, and service firms.

10 min read

Open Contract Alerts: 22-26 August 2022

Open Tender for Demonstration of Marine Zero Emission Propulsion Systems Date of announcement: 22-Aug-22 Short Description The contracting authority seeks…

5 min read

Explore how government contract data can support quantitative research.