

Public procurement is the process of purchasing goods, services, or works by the public sector from the private sector. According to the World Bank, public procurement represents, on average, nearly 20% of GDP globally.
Global government contracting data available through the Open:FactSet Marketplace monitors contract awards in more than 40 countries (including North America, EU, APAC) and accounts for nearly USD 15 trillion of government spending since 2010 (Figure 1). According to that database, nearly 40% of the contracts in developed countries are awarded to less than 8,000 publicly listed companies, showing a high concentration of significant contracting to a number of large public suppliers especially in the U.S. and EU-15 countries.
U.S. federal procurement alone accounts for more than USD 500 billion yearly on average (Figure 1) with contracting in a few major sectors including defense, healthcare, energy, IT, cybersecurity, and professional services being heavily skewed towards large-listed suppliers. Nevertheless, information about government contracts awards is not immediately incorporated into the stock prices of these traditional suppliers and can be used to construct signals for predicting cross-sectional stock returns for major suppliers to the U.S. government.
Figure 1. Global vs U.S. Federal Aggregate Contract Awards Value (2010-2020) (Bil.$) 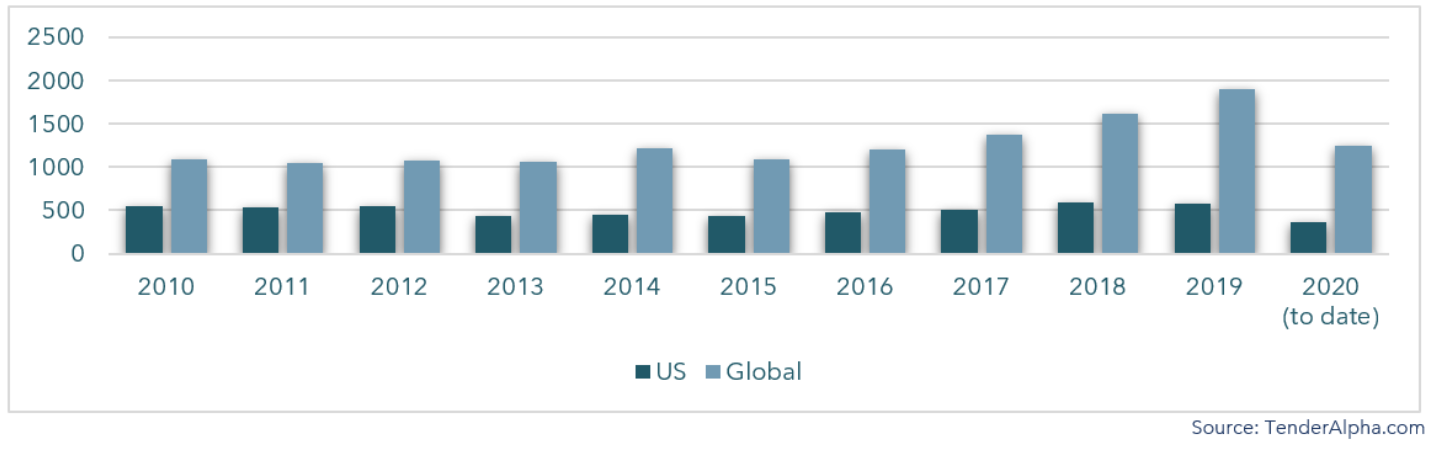
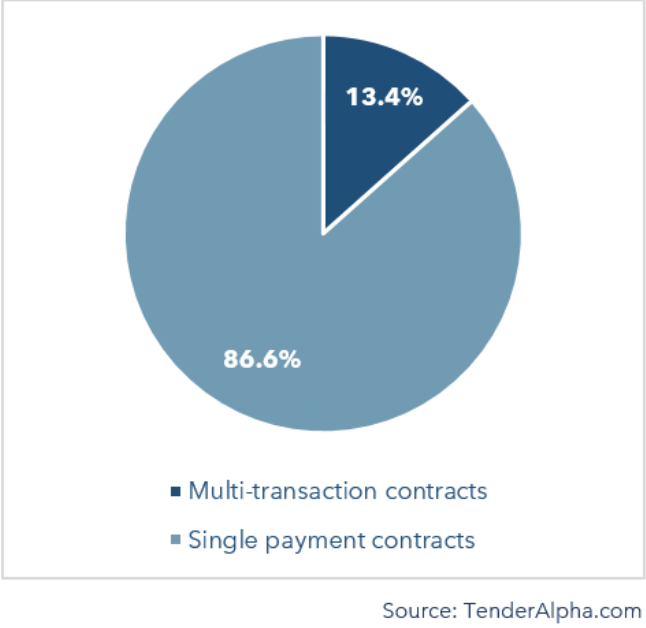
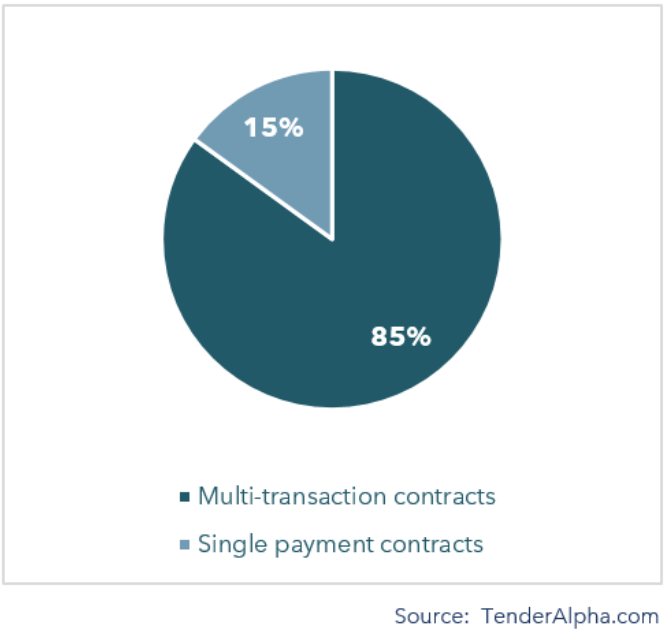
A study by TenderAlpha.com assumes that it is very costly for investors to process the information regarding government procurement contract awards sufficiently and quickly. While the biggest contracts catch the attention of media outlets, the vast majority of contract awards do not receive any press coverage. Furthermore, the U.S. federal procurement system allows very accurate forward-looking receivables projections as although smaller in number, multi-transaction contracts stand for nearly 90% of the total USD value of the federal awards made annually (Figure 2 and 3) or nearly USD 5 trillion from 2010 to today. Closely monitoring the public information on the entire payment cycle of each U.S. federal contracting enables accurate forward-looking projection on receivables from government contracting. The forward-looking receivables data is available per ticker.
Figure 2. Multiple Transaction vs. Single Payment U.S.Federal Contracts (Number of Contracts Distribution) (%) |
Figure 3. Multiple Transaction vs. Single Payment U.S.Federal Contracts (Distribution in terms of USD Value) (%) |
 |
 |
Long-Short Strategy Using Forward-Looking Receivables from U.S. Government Contracting
We used the database of forward-looking receivables from U.S. federal procurement between 2013 and 2019 to backtest multiple trading strategies that go long on firms with government receivables and short the rest of the market with variations of the weighting of stocks in the portfolios and the universe in which they are implemented. We followed a three-step process:
1. Scale forward-looking government receivables for each stock at the end of each month by the stock's market capitalization
2. Extract the unexpected component of receivables by subtracting the average forward-looking receivables for each firm over the past year and dividing by their standard deviation over the same period
3. Test the performance of the strategies by calculating their Sharpe ratios and estimating alphas with respect to various factor models controlling for market, size, value, momentum, profitability, and investment equity factors
Unexpected Government Receivables Signal
To arrive at a signal that captures the new information that is publicly available but difficult to process by investors in government receivables, we developed the unexpected government receivables (UGR) measure. The UGR measure is calculated by following these steps:
1. At the end of each month, for each stock, we scale the forward-looking government receivables by the stock's market capitalization and arrive at the scaled government receivables (SGR).
2. The unexpected government receivables (UGR) are the normalized SGR, where the normalization is done by subtracting the average SGR over the previous year and dividing by the standard deviation of SGR over the previous year.
The basic intuition behind the UGR measure is that investors should not be surprised about firms that consistently receive government contract awards or from a new contract awarded to a traditional supplier to the federal government that is not material compared to the usual USD size of contracts awarded to the same company. A high value of UGR indicates that a firm's forward-looking receivables have significantly increased over the past month relative to their average value over the past year, accounting for the variation in the receivables using the standard deviation in the denominator. We hypothesize that these are precisely the stocks for which it is difficult for investors to parse the information for new public contract announcements, especially in the context of aggregation of all already contracted U.S. federal future deliveries.
Based on domain public procurement knowledge and real-time/point-in-time monitoring of both the execution of existing contracts and the announcements of new federal contracts, the forward-looking receivables data offers a few steps of aggregation which are not available through any raw information from the institutional/media/company announcements. It is specifically designed to leverage the UGR effect as compared to the value of expected receivables (and thus the size of existing business with the federal government) at any point in time and over any given period of time.
Strong and Sustainable Backtesting Results
In all cases, the strategies perform extremely well and achieve annualized Sharpe ratios between 0.77 and 1.27, a range that spans between double and just over triple the historical Sharpe ratio of the market portfolio of 0.35–0.40.
The strategies' alphas are in all cases significant and range between 3.4% and 7.1% per year depending on the strategy and the factor model used. Our conclusions:
- A trading strategy that goes long in stocks that are in the highest tercile of UGR and short stocks with no government receivables, and equally weights stocks within the long and short portfolios, achieves an annualized Sharpe ratio of 1.27. Its alpha ranges from 5.4% to 7.1% per year depending on the factor model used and is highly statistically significantly different from zero;
- A more easily implementable market-cap-weighted version of this trading strategy achieves an annualized Sharpe ratio of 0.82, with alphas ranging from 4.3% to 4.6% per year;
- To further account for the ease of implementation, a version of the market-cap-weighted UGR trading strategy implemented only among the Russell 1,000 universe achieves an almost indistinguishable performance relative to the same strategy implemented in the full universe of publicly traded stocks noted above;
- Finally, we also backtest a strategy that is trivial to implement—one that goes long a market-cap-weighted portfolio of about 100 stocks on average that is in the top tercile of UGR among Russell 1000 stocks, and shorts the total market (e.g., a market ETF). This strategy yields an annualized Sharpe ratio of 0.77, and its alphas range from 3.4% to 4.1% per year;
- A version of this strategy in which the signal is updated daily instead of monthly achieves similar performance. Moreover, the results seem to be long-lasting—it takes up to seven months until the alpha becomes insignificant.
During the turbulent 2020, the TenderAlpha team devised an alternative trading strategy, which saw us scale not by market capitalization, but by accounting variables retrieved from the stocks’ annual financial statements, in order to avoid incurring portfolio turnover from sharp swings in the market essentially unrelated to the stocks’ receivables.
The alternative trading strategy generated an improved performance in 2020. For more details on our studies, contact us now.