It has been well documented that companies maintaining continued success in public procurement, also enjoy more predictability in their cash flow, and are generally more financially stable in insecure times. As discovered in our 'Government Receivables as a Stock Market Signal' white paper, winning government contracts is also likely to have a positive impact on a company’s stock price.
Therefore, we thought it would benefit our readers if we offered them detailed analyses of the financial results these major government contractors achieve.
It is now time for us to look again at a company we covered previously in this series. Science Application International (SAIC) recently reported its Q2 fiscal 2024 results and below we will provide a brief analysis of the company’s performance.
Key points:
* 97.9% government contracting exposure in Q2 of fiscal 2024
* Revenue down 2.6% Y/Y in Q2, impacted by divestments. Full year sales seen down 6.1% relative to 2023.
* Adjusted EPS up 17% Y/Y in Q2 to $2.05/share. Full year outlook increased to $7.3/share, down 3.3% Y/Y.
* Backlog down by 5.5% Q/Q to $22.5 billion, with a book-to-bill ratio of only 0.4 in Q2 and 0.8 for the trailing twelve months.
* Company expects order intake to pick up into H2 2024, with material acceleration expected for H2 2025.
SAIC Q2 Fiscal 2024 Results Overview
We previously covered Science Applications International's Q1 fiscal 2024 (the company utilizes a 52/53 week fiscal year ending on the Friday closest to January 31) results in part 43 of our Top Government Contractors series here. Below we will highlight the progress achieved by the company in Q2 of fiscal 2024.
Science Applications International, which we will refer to as SAIC hereafter, provides technical, engineering and enterprise IT services primarily to the U.S. government, which accounted for 97.9% of SAIC revenues in Q2 2024:
Figure 1: Science Applications International customer breakdown, Q2 2024
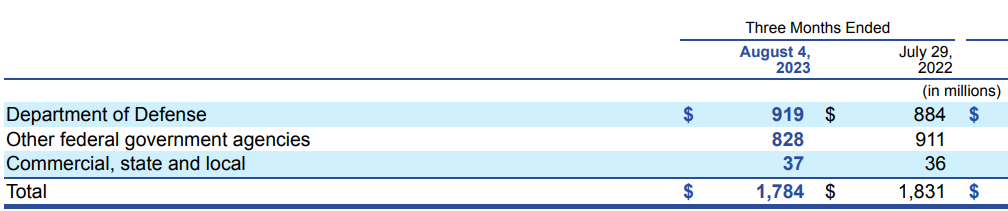
Source: Science Applications International Q2 2024 Form 10-Q
Within the U.S. government exposure, the Department of Defense accounts for 51.5% of Q2 2024 sales while Other federal government agencies made up 46.4%.
Operational Overview
Revenue fell 2.6% Y/Y in Q2 of fiscal 2024 (2023 +4%) on business divestments. Excluding divestment effects, revenue was up 8.3%.
Adjusted EBITDA increased 4.8% Y/Y in Q2 (2023 -1%), driven by a 0.7% margin improvement to 9.8% on lower indirect costs and improved portfolio profitability.
Adjusted EPS gained 17% Y/Y in Q2 to $2.05/share (2023 $7.55/share), helped by a 3.6% reduction in share count. Free cash flow was up 93% Y/Y to $143 million in Q2 (2023 $457 million) on the timing of payroll payments:
Figure 2: SAIC Q2 2024 results
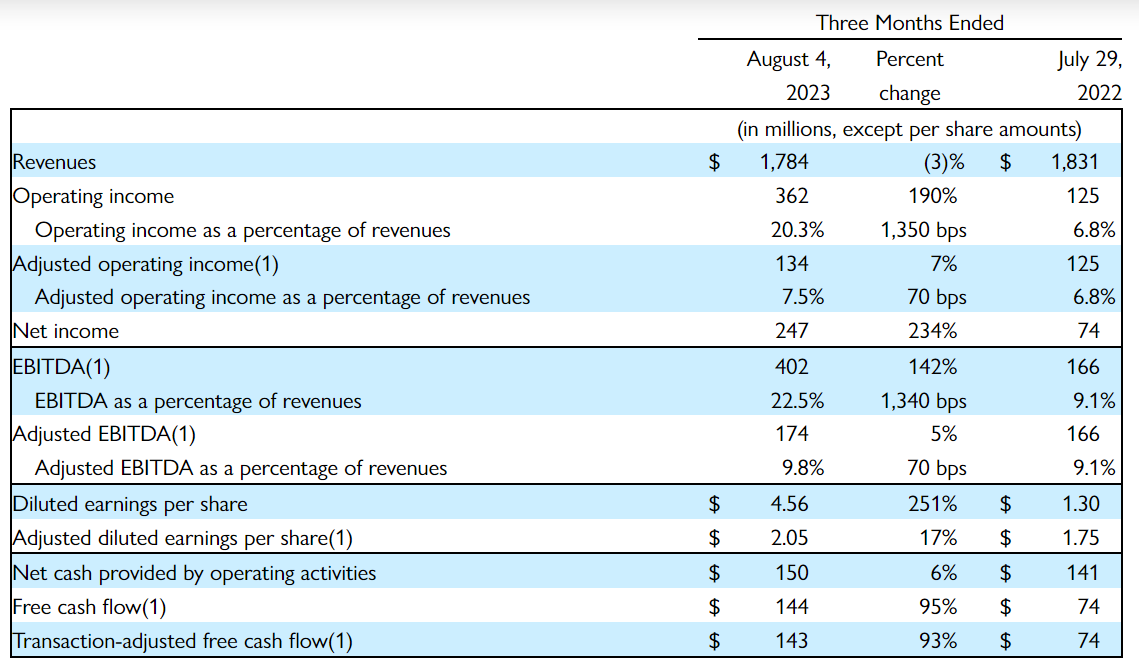
Source: SAIC Q2 2024 Earnings Release
Updated Fiscal 2024 Outlook
Following a strong first half of fiscal 2024, SAIC raised its revenue, adjusted EPS, margin and organic growth outlook for 2024:
Figure 3: Science Applications International Updated 2024 Guidance
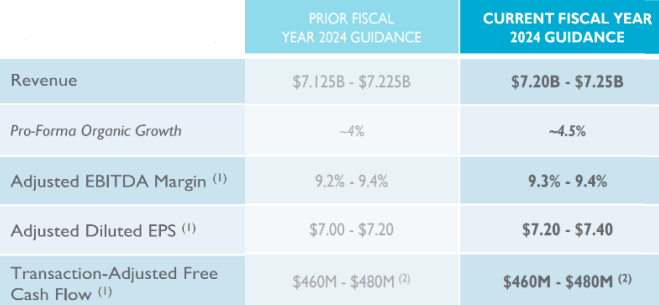
Source: Science Applications International Q2 2024 Earnings Presentation
Revenue is seen at about $7.225 billion, down 6.1% on a reported basis, with underlying business momentum only partially compensating the Logistics & Supply Chain management business exit.
Adjusted diluted EPS is expected at $7.3/share, down 3.3% Y/Y.
SAIC also released guidance for the remainder of 2024, with revenue in the fourth quarter expected to be especially weak on fewer work days compared to last year:
Figure 4: Science Applications International H2 2024 Outlook
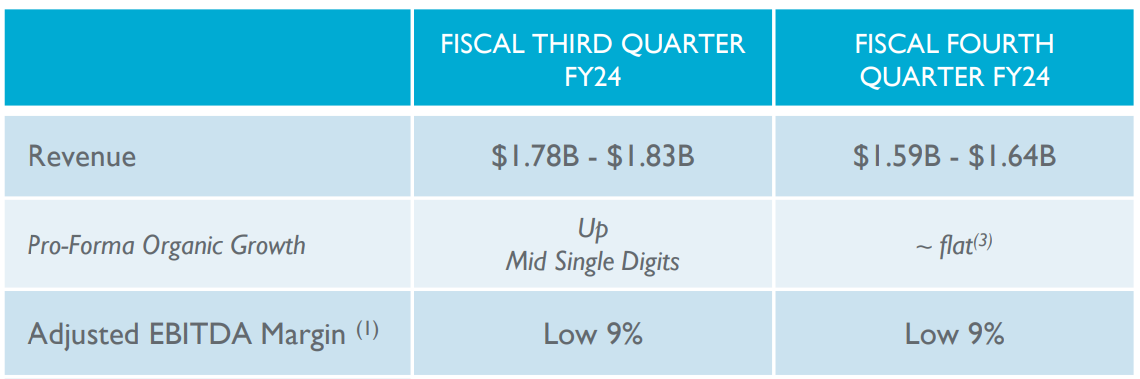
Source: Science Applications International Q2 2024 Earnings Presentation
The outlook for '25-'26 is unaffected by 2024 quarterly dynamics.
Backlog
Total backlog was down by 5.5% Q/Q to $22.5 billion. The book-to-bill ratio was particularly weak at only 0.4 in Q2 and 0.8 for the trailing twelve months. CFO Prabu Natarajan added additional details on the conference call:
Due primarily to the timing of expected awards, our bookings and book-to-bill are below where we had planned to be at the beginning of the year. As a reminder, our net bookings in the second quarter do not include any value from our $1.3 billion TCloud program, which cleared protest in the second quarter.
...we continue to see a strong and growing pipeline of opportunities and expect the value of both award activity and award submissions to improve materially in the second half of the year. In fact, since the beginning of the third quarter, we won approximately $1.1 billion of work, roughly 60% of which is for new business across multiple domains.
As highlighted in the chart below, some revenue may slip from H2 2024 to 2025:
Figure 5: Science Applications International Contract Awards in 2024
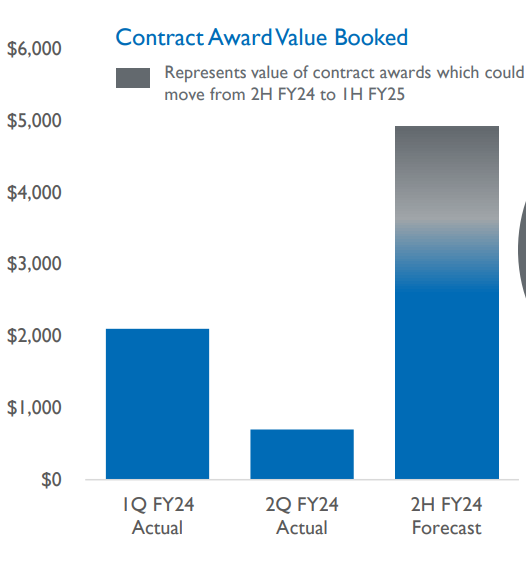
Source: Science Applications International Q2 2024 Earnings Presentation
Capital Structure
SAIC ended Q1 with a net debt of $1.93 billion, retaining the position of one of the most indebted government contractors in our series, in light of its $5.6 billion market capitalization.
In Q2 SAIC spent $100 million on share buybacks, $20 million on dividends and $6 on capex.
Conclusion
As one of the more financially levered players in the government contracting market, SAIC is in a position to benefit from interest rate cuts expected from the Federal Reserve in '24-'26.
While the company increased its revenue, EPS, margin and organic growth outlook for 2024, the outlook for fiscal '25 and '26 was unchanged.
The shrinking backlog and expectations for flat revenue growth in Q4 may signal a deteriorating revenue outlook. Even if the weak backlog dynamics prove to be only temporary, gradual ramp-up of contract awards may shift some revenue from H2 2024 to 2025, particularly the second half of the year, as explained by CFO Prabu Natarajan:
...we expect the first-half FY25 revenues to be roughly flat year-over-year, pro forma for our logistics and supply chain management divestiture, before inflecting to more meaningful growth in the second half of FY25. We have visibility into this growth given recent wins and opportunities in our pipeline.
In light of the fact that 98% of SAIC sales were to the U.S. government in each of the last three fiscal years, monitoring the company’s public procurement activity remains a smart move that can provide key insights into its financial health.
To learn more about the ways in which TenderAlpha can provide you with insightful public procurement data, get in touch now!
This article was written by members of TenderAlpha's team and does not serve as a recommendation to buy SAIC or any other stock. TenderAlpha is not receiving compensation for it and we have no business relationship with any company whose stock is mentioned in this article.